Diferencia entre revisiones de «Translations:Graphics/4/en»
De wiki.kiconex
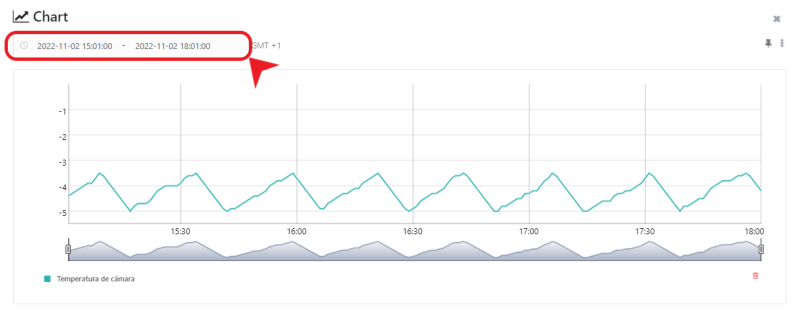
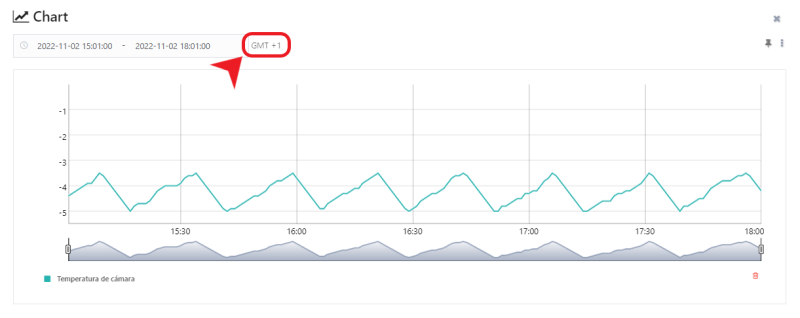
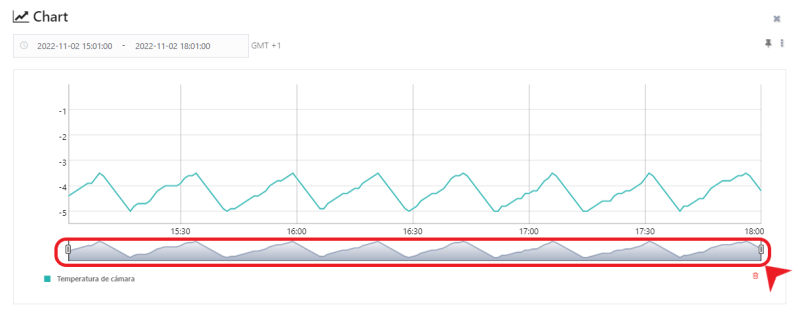
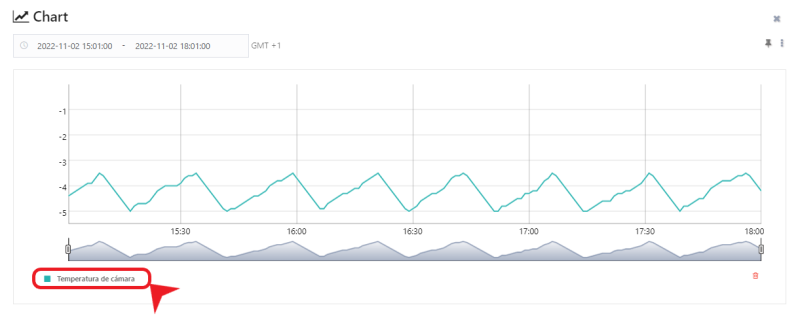
Página creada con «=== Graph configuration points === The graph looks as follows: alt=time graph|centro|miniatureimage|780x780px|Time period (start and end date) shown on the graph alt=timezone_graph|centro|miniatureimage|780x780px|Displayed information time zone alt=timezoom_graph|centro|miniatureimage|780x780px|Zoom bar over the period of time shown on the graph Archivo:LEYENDA G.png|alt=legend_gra…» |
Sin resumen de edición |
||
| Línea 1: | Línea 1: | ||
=== Graph configuration points === | === Graph configuration points === | ||
The graph looks as follows: | The graph looks as follows: | ||
[[Archivo:PERIODO G.png|alt=time graph|centro|miniatureimage| | [[Archivo:PERIODO G.png|alt=time graph|centro|miniatureimage|800x800px|Time period (start and end date) shown on the graph]] | ||
[[Archivo:TIMEZONE G.png|alt=timezone_graph|centro|miniatureimage| | [[Archivo:TIMEZONE G.png|alt=timezone_graph|centro|miniatureimage|800x800px|Displayed information time zone]] | ||
[[Archivo:ZOOM-TIEMPO Graf.png|alt=timezoom_graph|centro|miniatureimage| | [[Archivo:ZOOM-TIEMPO Graf.png|alt=timezoom_graph|centro|miniatureimage|800x800px|Zoom bar over the period of time shown on the graph]] | ||
[[Archivo:LEYENDA G.png|alt=legend_grafica|centro|miniatureimage| | [[Archivo:LEYENDA G.png|alt=legend_grafica|centro|miniatureimage|800x800px|Legend with date curve information]] | ||


