Diferencia entre revisiones de «Graphics/en»
Página creada con «== Access to the data history of a variable == It is easily open the data history of a variable, wherever the variable is visible:» |
Sin resumen de edición |
||
| (No se muestran 6 ediciones intermedias del mismo usuario) | |||
| Línea 1: | Línea 1: | ||
=Graphics | =Graphics= | ||
This is one of the most important modules of ''myKiconex'' platform. With this tool, it is possible to make temporary graphical representations of analog/digital variables and states. The module allows data comparisons of different controls and facilities, as well as the creation of preconfigured graphs for easier access to historical behavioral data. | This is one of the most important modules of ''myKiconex'' platform. With this tool, it is possible to make temporary graphical representations of analog/digital variables and states. The module allows data comparisons of different controls and facilities, as well as the creation of preconfigured graphs for easier access to historical behavioral data. | ||
__TOC__ | __TOC__ | ||
In myKiconex platform, data can be saved over time (see section on control saving interval configuration). These data can be visualized in a graph to analyze the behavior of a control over time. | In myKiconex platform, data can be saved over time (see section on control saving interval configuration). These data can be visualized in a graph to analyze the behavior of a control over time. | ||
== Access to the data history of a variable == | == Access to the data history of a variable == | ||
It is easily open the data history of a variable, wherever the variable is visible: | It is easily open the data history of a variable, wherever the variable is visible: | ||
| Línea 14: | Línea 15: | ||
=== Graph configuration points === | === Graph configuration points === | ||
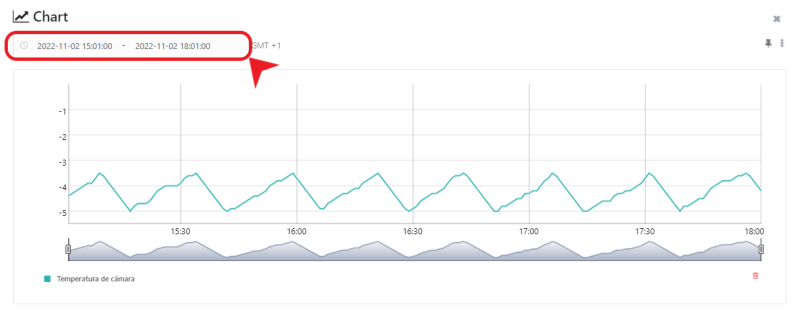
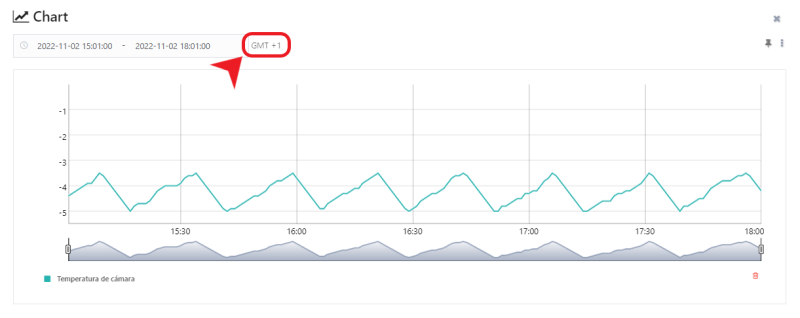
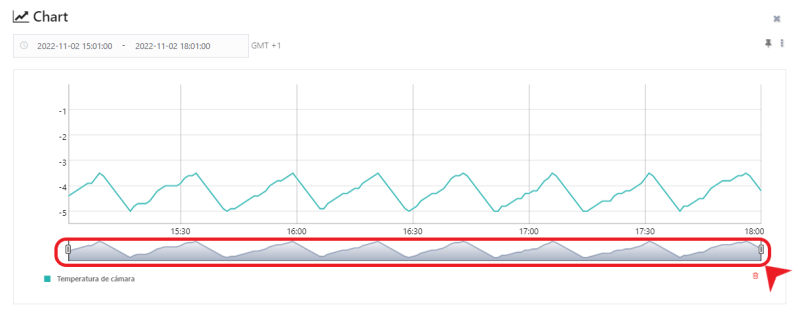
The graph looks as follows: | The graph looks as follows: | ||
[[Archivo:PERIODO G.png|alt=time graph|centro|miniatureimage| | [[Archivo:PERIODO G.png|alt=time graph|centro|miniatureimage|800x800px|Time period (start and end date) shown on the graph]] | ||
[[Archivo:TIMEZONE G.png|alt=timezone_graph|centro|miniatureimage| | [[Archivo:TIMEZONE G.png|alt=timezone_graph|centro|miniatureimage|800x800px|Displayed information time zone]] | ||
[[Archivo:ZOOM-TIEMPO Graf.png|alt=timezoom_graph|centro|miniatureimage| | [[Archivo:ZOOM-TIEMPO Graf.png|alt=timezoom_graph|centro|miniatureimage|800x800px|Zoom bar over the period of time shown on the graph]] | ||
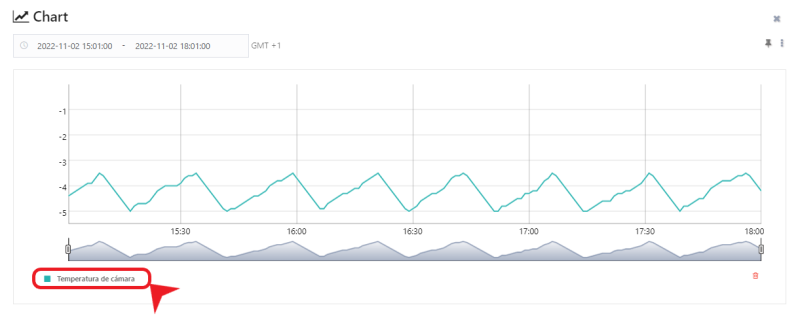
[[Archivo:LEYENDA G.png|alt=legend_grafica|centro|miniatureimage| | [[Archivo:LEYENDA G.png|alt=legend_grafica|centro|miniatureimage|800x800px|Legend with date curve information]] | ||
== Overlapping data from several variables on the same graph == | |||
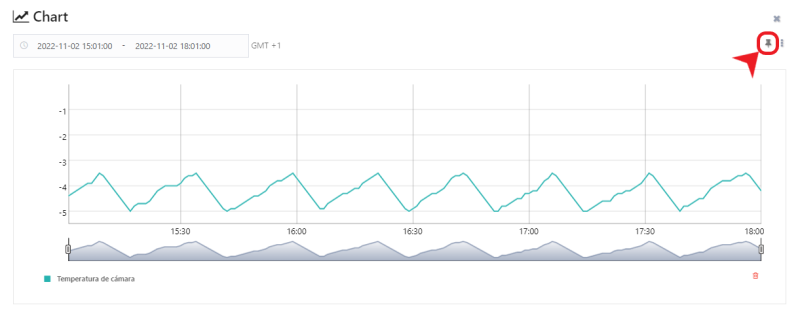
It is possible to overlap the data of different variables on the same graph. To do this, use the button with the "pushpin" symbol: | |||
[[Archivo:CHINCHETA G.png|alt=graphic blue pushpin|centro|miniatureimage|800x800px|By marking the '''pin''' symbol in '''blue''' color, the graph is not lost when you close and reopen the data history of another variable]] | |||
[[Archivo:CHINCHETA G.png|alt= | The process for overlapping several graphs is shown below: | ||
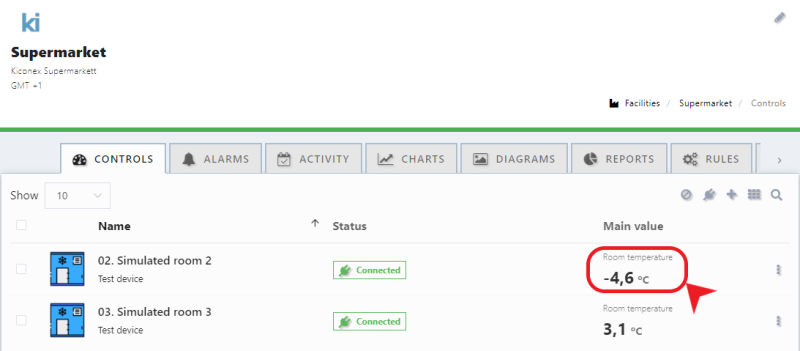
[[Archivo:FIRST VALUE CHART.png|alt=first_chart_value|centro|miniatureimage|800px|1 - Open the '''first variable''' graph.]] | |||
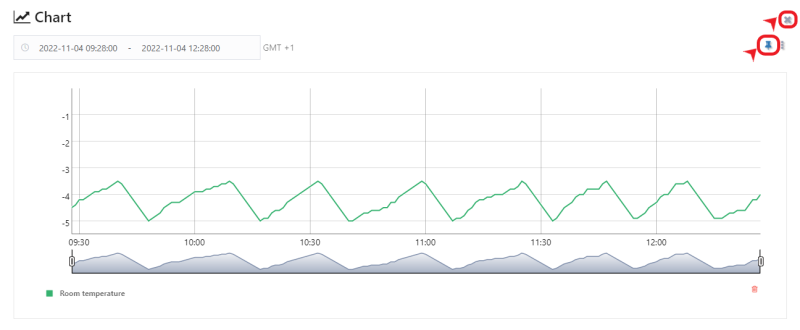
[[Archivo:FIRST VALUE CHART.png|alt=first_chart_value|centro| | [[Archivo:CHINCHETA AZUL AND CLOSE.png|alt=blue pushpin|centro|miniatureimage|800x800px|2 - Mark the '''pushpin''' in '''blue''' and close the graph.]] | ||
[[Archivo:CHINCHETA AZUL AND CLOSE.png|alt= | [[Archivo:SECOND VALUE CHART.png|alt=second_chart_value|centro|miniatureimage|800x800px|3 - Open the graph of the second variable.]] | ||
[[Archivo:SECOND VALUE CHART.png|alt=second_chart_value|centro| | [[Archivo:GRAPH WITH TWO VALUES.png|alt=Graph with two values|centro|miniatureimag|800x800px|4 - When the '''pushpin''' is marked in '''blue''', a graph is opened with the new variable and the previous graph is maintained.]] | ||
[[Archivo:GRAPH WITH TWO VALUES.png|alt= | |||
== Saving a graph permanently === | |||
== | There is the possibility to permanently save the graph, in order to have it accessible from the list of graphs of the user (left side menu) or from the list of graphs of the facility(menu "GRAPHICS" inside the facility). The following images show a graph with the data of several variables and the saving process: | ||
[[Archivo:SAVE GRAPH BTN.png|alt=Save graph button|centro|miniatureimage|800px|1 - Click on '''Save''' option in the graph that opens from the control view.]] | |||
[[Archivo:SAVE GRAPH BTN.png|alt= | [[Archivo:SAVE CHART CONFIRMATION.png|alt=Save graph confirmation|centro|miniatureimage|800x800px|2 - Confirm creation of the graph.]] | ||
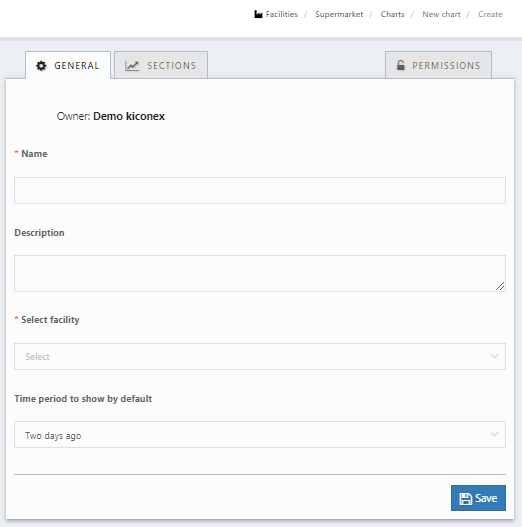
[[Archivo:SAVE CHART CONFIRMATION.png|alt= | [[Archivo:GENERAL DATA NEW GRAPH.png|alt=General data new graph|centro|miniatureimage|800x800px|3 - Specify general data of the graph: '''name''', '''description''', '''facility''' to which it belongs and '''period of time that will be displayed by default''' when accessing it.]] | ||
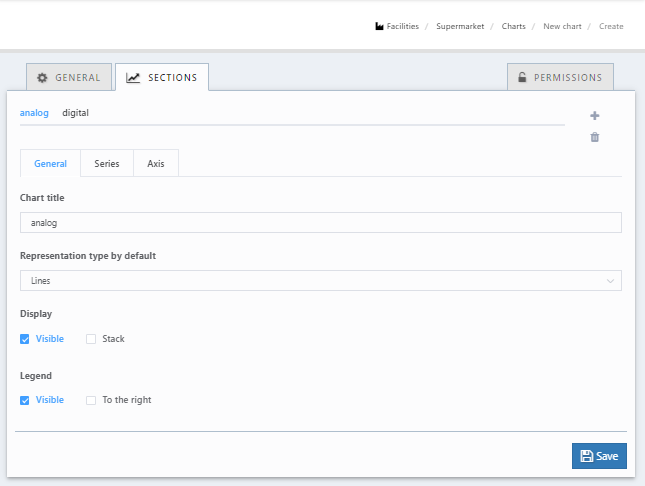
[[Archivo:GENERAL DATA NEW GRAPH.png|alt= | [[Archivo:SECTION DATA NEW GRAPH.png|alt=Section data new graph|centro|miniatureimage|800x800px|4 - The variables that appeared in the graph are shown in '''"SECTIONS"''' tab. Here, it is able to adjust how you want to see the data curves. The saving process is completed by clicking on the blue '''"SAVE"''' button.]] | ||
[[Archivo:SECTION DATA NEW GRAPH.png|alt= | |||
== Downloading the data of a graph == | |||
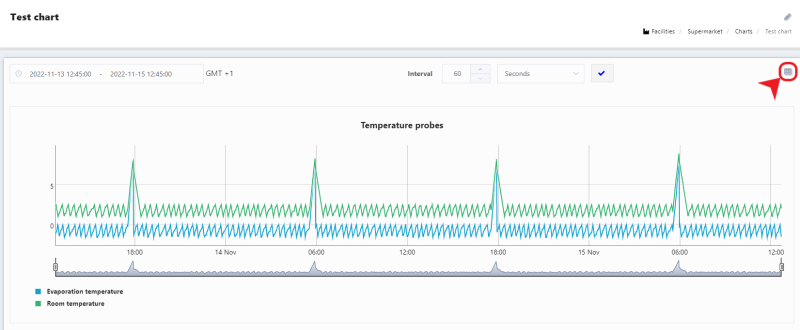
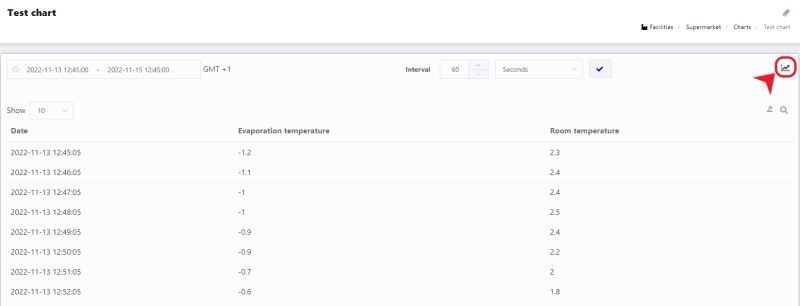
After saving a graph following the steps of the previous point, there is the possibility to download the historical data in an Excel file. The following images show the icon that allows you to switch between the graph view and the data table view: | |||
===== Toggle between graph and chart view ===== | |||
[[Archivo:TABLE ICON.png|centro|miniatureimage|800x800px|Icon to view graph data in chart format]] | |||
= | [[Archivo:CHART ICON.png|centro|miniatureimagen|800x800px|Icon for viewing the chart data in a graph format]] | ||
[[Archivo:TABLE ICON.png|centro| | |||
[[Archivo:CHART ICON.png|centro| | |||
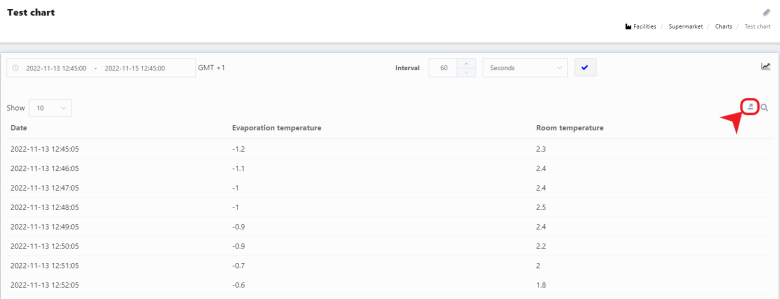
The data chart can be downloaded from the icon in the image below: | |||
[[Archivo:EXPORT DATA ICON.png|alt=Export data icon|centro|miniatureimage|780x780px|Export of the data chart in a '''.csv''' file.]] | |||
Revisión actual - 18:50 27 ago 2024
Graphics
This is one of the most important modules of myKiconex platform. With this tool, it is possible to make temporary graphical representations of analog/digital variables and states. The module allows data comparisons of different controls and facilities, as well as the creation of preconfigured graphs for easier access to historical behavioral data.
In myKiconex platform, data can be saved over time (see section on control saving interval configuration). These data can be visualized in a graph to analyze the behavior of a control over time.
Access to the data history of a variable
It is easily open the data history of a variable, wherever the variable is visible:
- Facility controls tab
- Simple control view
- Extended control view
- Facility diagram
Graph configuration points
The graph looks as follows:
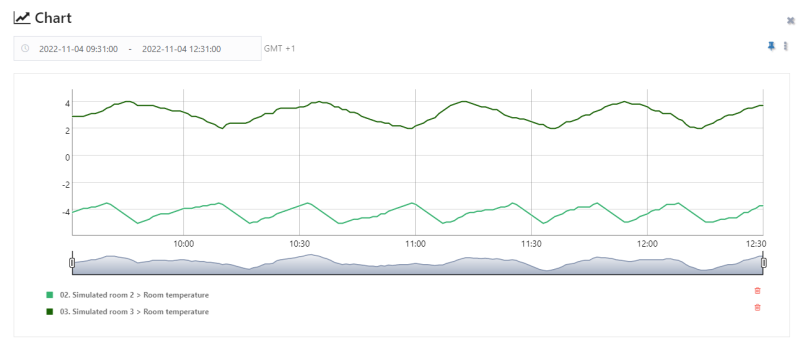
Overlapping data from several variables on the same graph
It is possible to overlap the data of different variables on the same graph. To do this, use the button with the "pushpin" symbol:
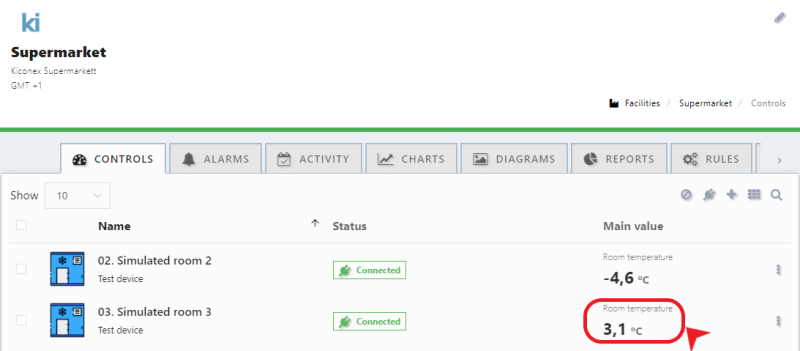
The process for overlapping several graphs is shown below:
Saving a graph permanently =
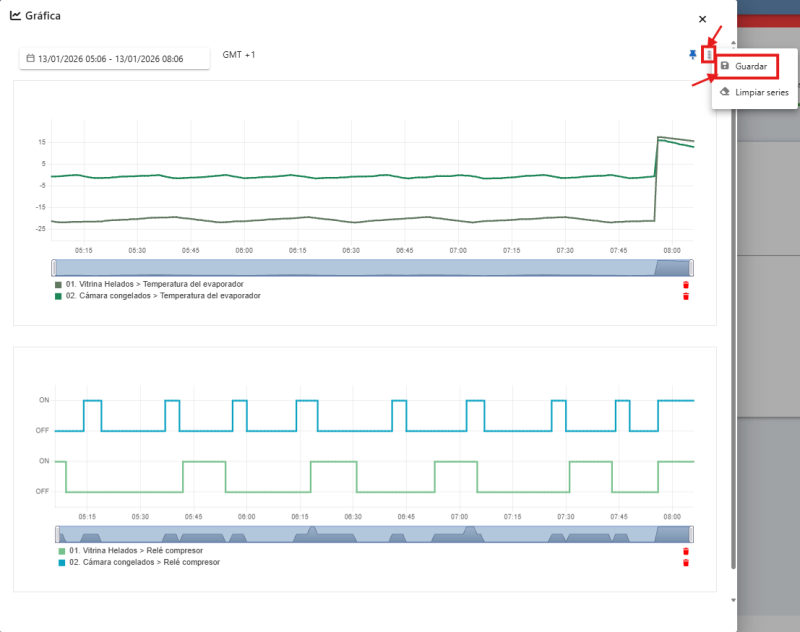
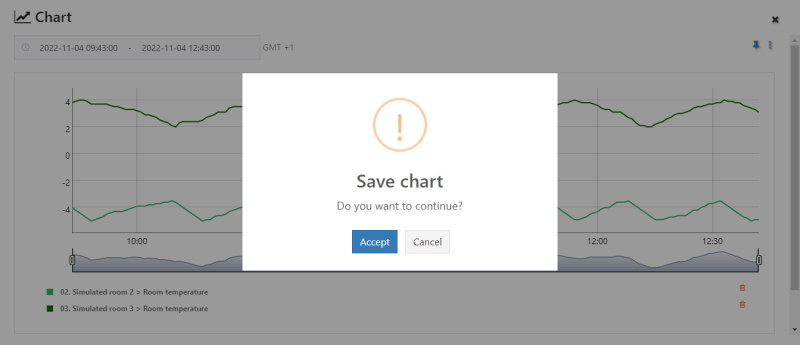
There is the possibility to permanently save the graph, in order to have it accessible from the list of graphs of the user (left side menu) or from the list of graphs of the facility(menu "GRAPHICS" inside the facility). The following images show a graph with the data of several variables and the saving process:
Downloading the data of a graph
After saving a graph following the steps of the previous point, there is the possibility to download the historical data in an Excel file. The following images show the icon that allows you to switch between the graph view and the data table view:
Toggle between graph and chart view
The data chart can be downloaded from the icon in the image below:
