Diferencia entre revisiones de «Reports/en»
Actualizando para coincidir con nueva versión de la página fuente |
Sin resumen de edición |
||
| Línea 2: | Línea 2: | ||
Reports are one of mykiConex tool that allows to export data from connected devices. Currently, there are two types of reports: | Reports are one of mykiConex tool that allows to export data from connected devices. Currently, there are two types of reports: | ||
* '''Data export''': enabled exclusively in facilities with PROFESSIONAL or PREMIUM plan. Allows to export in Excel file the historical data of the desired variables, being able to select a start and end date of the data to be downloaded, as well as a time interval between data and downloaded data. | * '''Data export''': enabled exclusively in facilities with PROFESSIONAL or PREMIUM plan. Allows to export in Excel file the historical data of the desired variables, being able to select a start and end date of the data to be downloaded, as well as a time interval between data and downloaded data. | ||
* '''Statistical report''': enabled exclusively in facilities with PREMIUM plan. It performs a very simple statistical analysis of the selected variables: | * '''Statistical report''': enabled exclusively in facilities with PREMIUM plan. It performs a very simple statistical analysis of the selected variables: | ||
** For analog variables: maximum, minimum and average. | ** For analog variables: maximum, minimum and average. | ||
** For digital variables: percentage of active and inactive times, number of active times. | ** For digital variables: percentage of active and inactive times, number of active times. | ||
| Línea 55: | Línea 53: | ||
# '''List of the variables''' involved in the report, showing information on the facility and the control to which they belong. | # '''List of the variables''' involved in the report, showing information on the facility and the control to which they belong. | ||
[[Archivo:SP Partes del informe.png|centro|miniaturadeimagen|800x800px| | [[Archivo:SP Partes del informe.png|centro|miniaturadeimagen|800x800px|Report sections]] | ||
Revisión actual - 07:09 10 abr 2024
Reports
Reports are one of mykiConex tool that allows to export data from connected devices. Currently, there are two types of reports:
- Data export: enabled exclusively in facilities with PROFESSIONAL or PREMIUM plan. Allows to export in Excel file the historical data of the desired variables, being able to select a start and end date of the data to be downloaded, as well as a time interval between data and downloaded data.
- Statistical report: enabled exclusively in facilities with PREMIUM plan. It performs a very simple statistical analysis of the selected variables:
- For analog variables: maximum, minimum and average.
- For digital variables: percentage of active and inactive times, number of active times.
Reports can be created from the corresponding section within instalación.
From the left side menu, all the reports created in any of the facilities are shown.
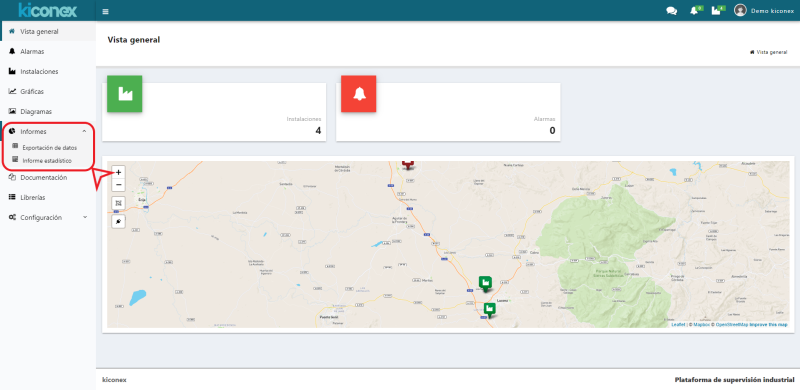
Report creation
By accessing the facility, it access the reports:
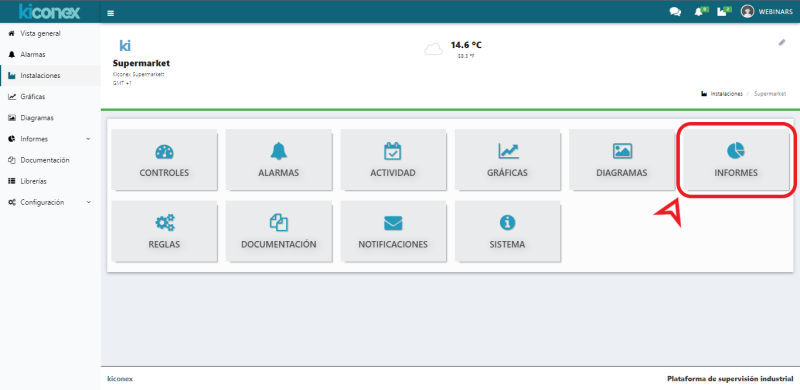 |
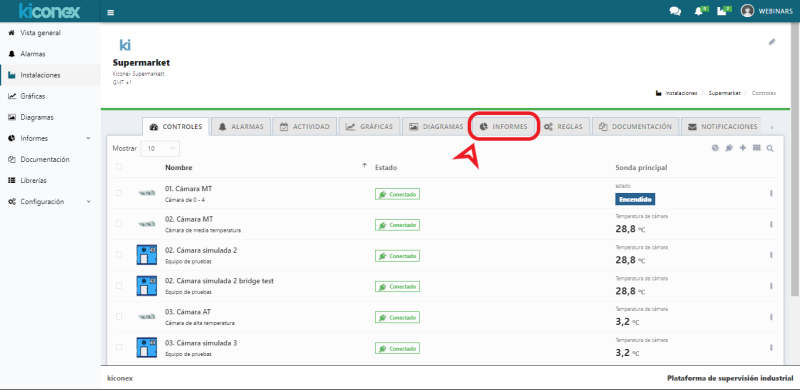 |
From this section, there are two tabs: one to list each type of report. Turther to the right is the "+" icon to create a new report.
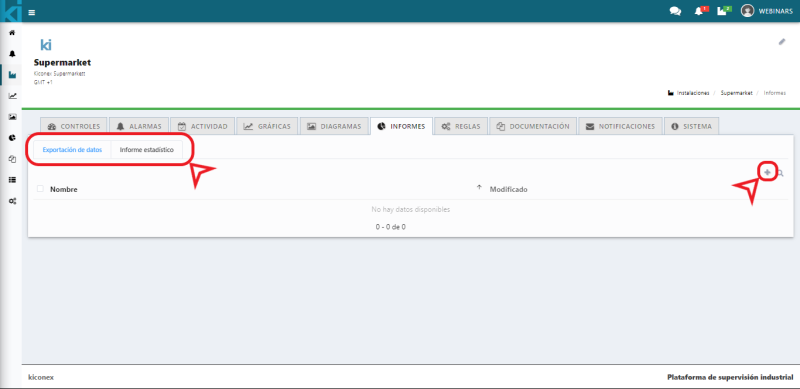
Clicking on the creation icon takes you to a window with three configuration tabs:
- GENERAL: name and description for the report.
- Report configuration: an interval between each variable data is established. Besides being able to add these variables from the "+" icon, to the right of Current series.
- PERMISSIONS: tab allowed to give permissions to another user to view the created report. By default, the report can only be viewed by the user who created it.


To add variables to the report, click on the "+" icon, which opens the following window:
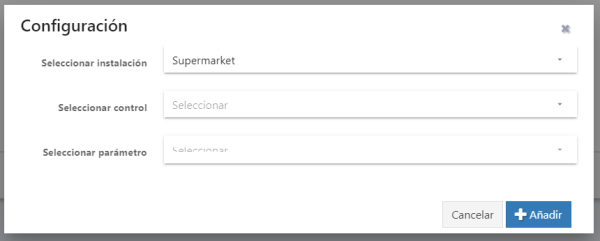
In this window, one or several variables of interest can be selected.
Editing the report
The report can be edited from two places: by right mouse clicking on it and selecting the edit option. As shown in these images:
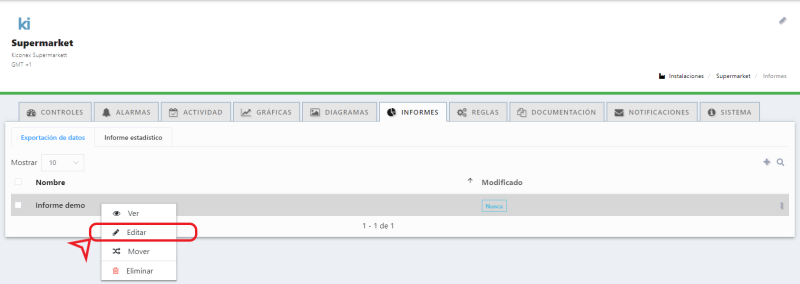

Downloading the report
Before downloading the report, it is necessary to confirm the start and end date of the data to be downloaded, as well as the time interval between each data point. The following image shows each of the points of the report:
- Start and end date of the data to be processed. In the example image below a week of data has been selected. Shown right is the time zone with which the data will be downloaded, for more information you can consult the configuration of the facility or of the user profile.
- Interval: Time between each data. It has a minimum value that depends on the configuration of the variables of the control. By default, it is usual to use a 60 sec interval for most connected controls.
- Type: indicates the type of report to be downloaded.
- List of the variables involved in the report, showing information on the facility and the control to which they belong.
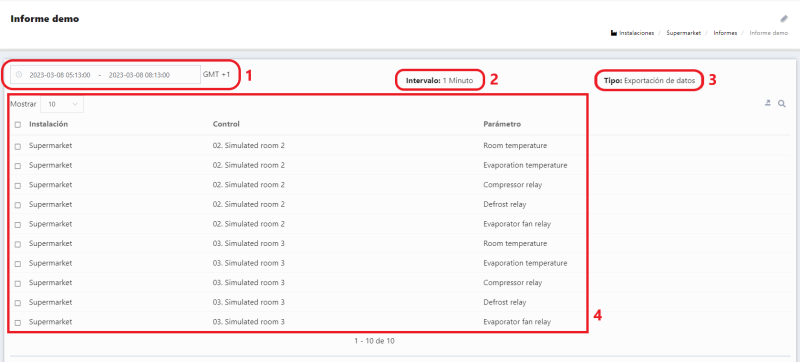
To download the report, just click on the arrow symbol next to the magnifying glass, as shown in the image below:
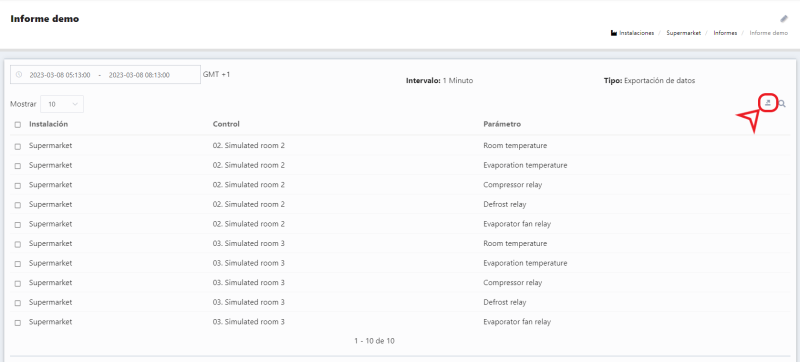
The download will take time depending on the amount of data requested. For instance: if months of data are requested, the query will take longer and therefore the user will wait longer until the report is downloaded.
Interpretation of a data export report
The result of downloading a data export report, is an excel with the appearance of the following image:

The information shown is as follows:
- Organization's logo' in the header
- 5 lines for each variable, where it is indicated:
- Facility of origin of the variable
- Control to which the variable belongs
- Name
- Unit of measure
- 'Type. How the platform interprets that variable: analog or digital
- One line for each data recorded for each variable. The first column shows the date and time of data recording and in the column of each variable the corresponding value.
Interpretation of a statistical report
The result of downloading a statistical report, is an excel with the appearance of the following image:
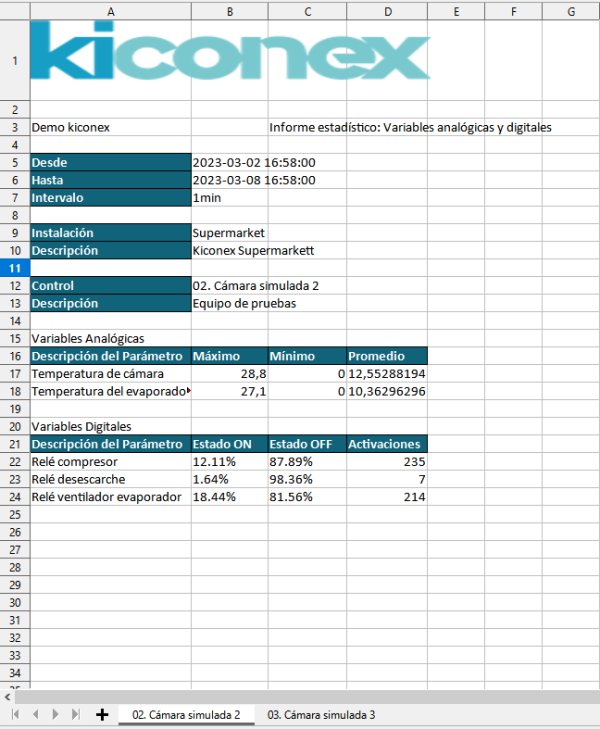
The information displayed is as follows:
- Logo of the organization in the header.
- User who has downloaded the report.
- Time data:
- Start date of the analyzed data
- End date of the data
- Interval or time between each data involved in the analysis.
- Name and description of the facility to which the variables belong.
- Name and description of the control containing the variables.
- Analysis of analog variables, with the data: maximum, minimum and average.
- Analysis of digital variables: indicates % on and % off, as well as a count of the number of activations the variable has undergone.
As can be seen, a data sheet is created for each control involved, so that performance comparisons can be made for controls of the same model.
