Diferencia entre revisiones de «Diagrams/en»
Página creada con «The display of the value can be enabled or disabled and configured the X and Y position indicating the size at which the user wants to display the value. The preview of the item will be displayed upon completion.» |
Página creada con «* '''Add image'''. Add a background image or an image to be used in some element. * '''Add parameter'''. Menu to select variables of a control to display in the diagram. * '''Add button'''. Used to add a button to the diagram to perform an action when clicked. * '''Add object'''. Use it to add a shape or object to the diagram. * '''Add text'''. Menu to include a text with its properties. *…» |
||
| Línea 104: | Línea 104: | ||
There is drop-down menu where the user can select the different actions that this parameter can perform as soon as it clicks on its area, it can change layer, load diagram, load facility, load control, go to an external link or simply the action of the parameter. | There is drop-down menu where the user can select the different actions that this parameter can perform as soon as it clicks on its area, it can change layer, load diagram, load facility, load control, go to an external link or simply the action of the parameter. | ||
Next to it is the Destination setting that will indicate the possible options once the previous tab has been selected. The preview of the item will be displayed upon completion. | |||
[[Archivo:Pestaña acción en añadir parámetros.png|centro|miniaturadeimagen|800x800px|Pestaña acción en añadir parámetros]] | [[Archivo:Pestaña acción en añadir parámetros.png|centro|miniaturadeimagen|800x800px|Pestaña acción en añadir parámetros]] | ||
Once these configurations have been completed, click on "add" and this parameter will be added to the diagram, it can be placed wherever the user wishes. | |||
[[Archivo:Visualización de añadir parámetro en configuración del diagrama.png|centro|miniaturadeimagen|800x800px|Visualización de añadir parámetro en configuración del diagrama]] | [[Archivo:Visualización de añadir parámetro en configuración del diagrama.png|centro|miniaturadeimagen|800x800px|Visualización de añadir parámetro en configuración del diagrama]] | ||
=== Add button === | |||
To add a button, click on the icon shown below in the configuration bar of the diagram: | |||
[[Archivo:Añadir botón en barra de configuración del diagrama.png|centro|miniaturadeimagen|Añadir botón en barra de configuración del diagrama]] | [[Archivo:Añadir botón en barra de configuración del diagrama.png|centro|miniaturadeimagen|Añadir botón en barra de configuración del diagrama]] | ||
Clicking on the icon will open a configuration panel where it has three configuration tabs: | |||
==== Shape ==== | |||
==== | This tab is for setting the height, width, radius and color of the button area. The preview of the item will be displayed upon completion. | ||
[[Archivo:Pestaña forma en añadir un botón.png|centro|miniaturadeimagen|800x800px|Pestaña forma en añadir un botón]] | [[Archivo:Pestaña forma en añadir un botón.png|centro|miniaturadeimagen|800x800px|Pestaña forma en añadir un botón]] | ||
==== Text ==== | |||
==== | Here is for setting the text, size and color. The preview of the item will be displayed upon completion. | ||
[[Archivo:Pestaña de texto en añadir un botón.png|centro|miniaturadeimagen|800x800px|Pestaña de texto en añadir un botón]] | [[Archivo:Pestaña de texto en añadir un botón.png|centro|miniaturadeimagen|800x800px|Pestaña de texto en añadir un botón]] | ||
<div lang="es" dir="ltr" class="mw-content-ltr"> | <div lang="es" dir="ltr" class="mw-content-ltr"> | ||
Revisión del 07:29 24 oct 2023
Diagrams
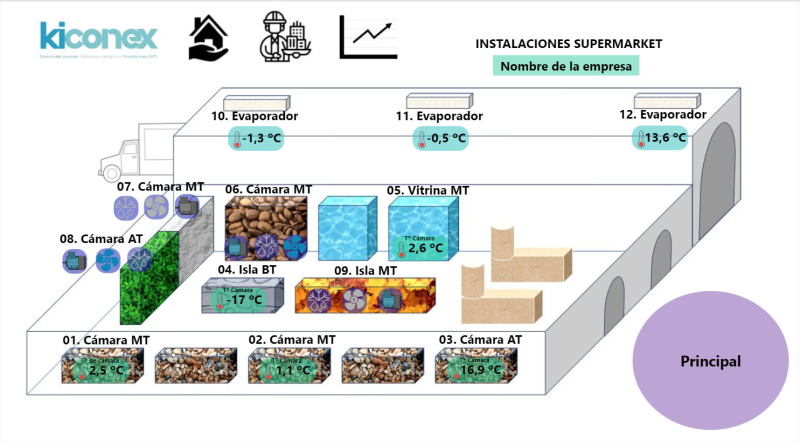
The diagrams module allows to make synoptic diagrams of one or several facilities in SCADA mode where images and variables can be mixed in real time to obtain status and operation information on a simple screen.
The configuration of these diagrams is done directly in myKiconex platform in an easy and intuitive way. Images, analog variables, digital variables, dynamic icons, action buttons, layer change links...etc. can be included.
The variables configured in each diagram will be displayed in real time and can be plotted by clicking on the different elements.
In addition to the above, there is a full screen view mode in myKiconex web app. In this way, the diagram can be viewed as if it were a stand-alone SCADA application including all possibilities for viewing, navigation, interaction, etc.
Diagram Configuration
To create a diagram, access the facility and then navigate to the "Diagrams" subsection.
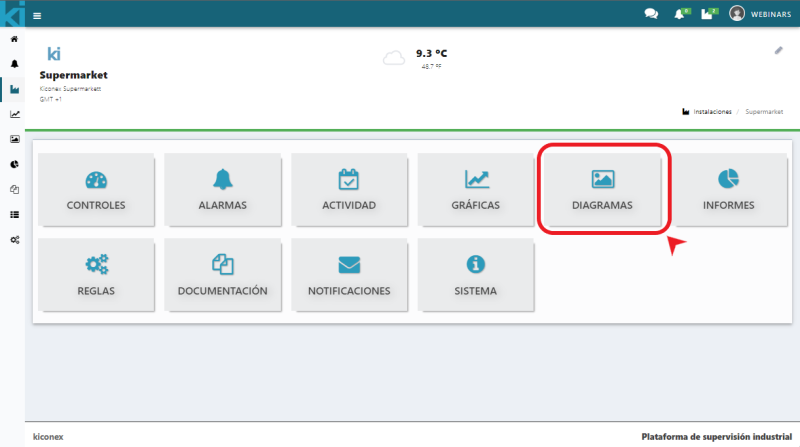
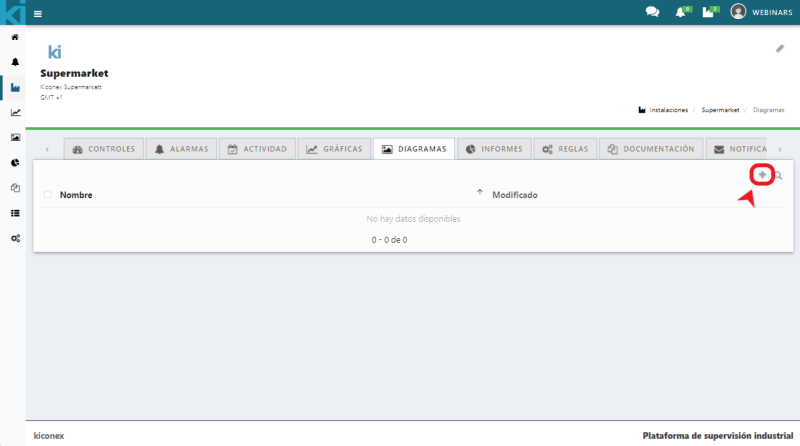
When accessing, you can find the list of diagrams. If any diagram is available, the name, description and date of the last modification will be displayed. If a diagram has already been created, it will appear in this list. Otherwise, a new one can be created by clicking on the + icon.
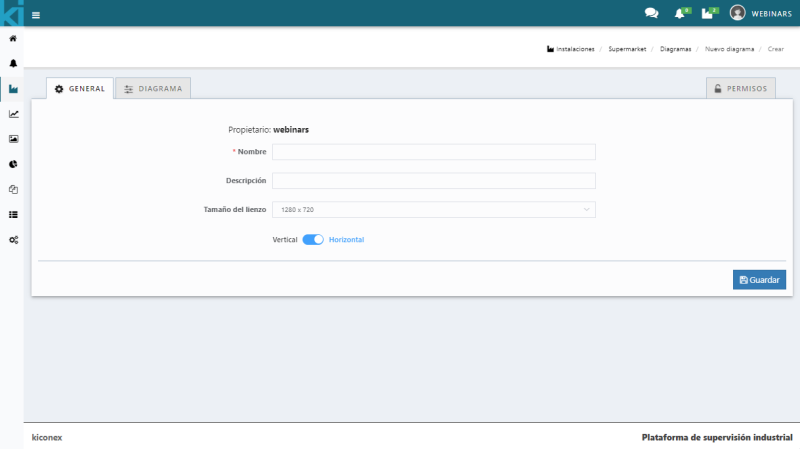
By clicking on the + icon, you can access the diagram general configuration panel where the name and description of the diagram must be configured. Next, you must select the canvas format to be used. By default it comes with the dimensions 1280 x 720 pixels, although you can choose between 800 x 600px up to 1920 x 1080px, both vertically and horizontally.
The next step is to access the diagram tab where the content of the diagram is defined.
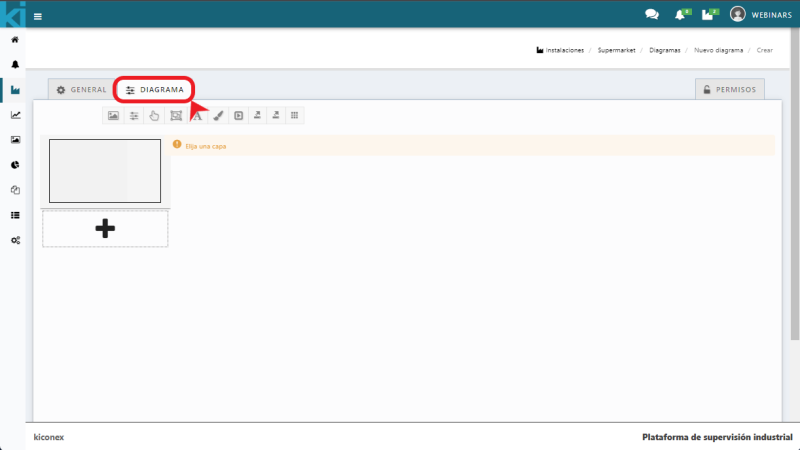
The main thing is to choose a layer as the main layer, this will be the initial screen when opening the diagram. Once chosen, a layer with a grid will be displayed. By clicking on save, on the bottom icon of the diagram, all changes will be saved.
To modify an existing diagram, right click on a diagram and select edit. You can also enter the diagram and click on the pencil icon to edit it.
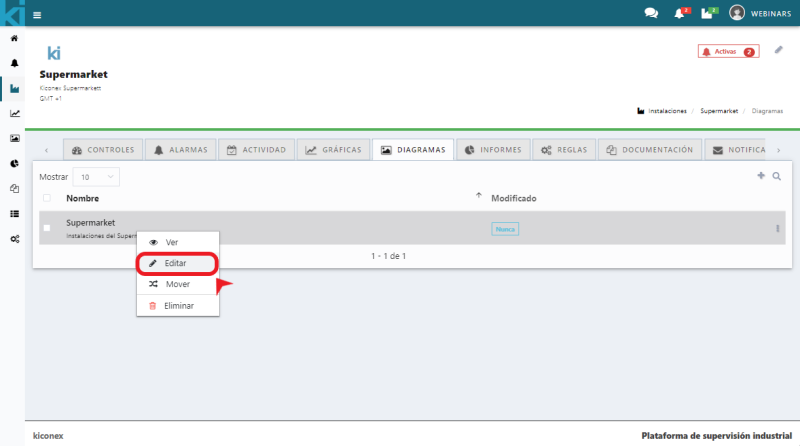
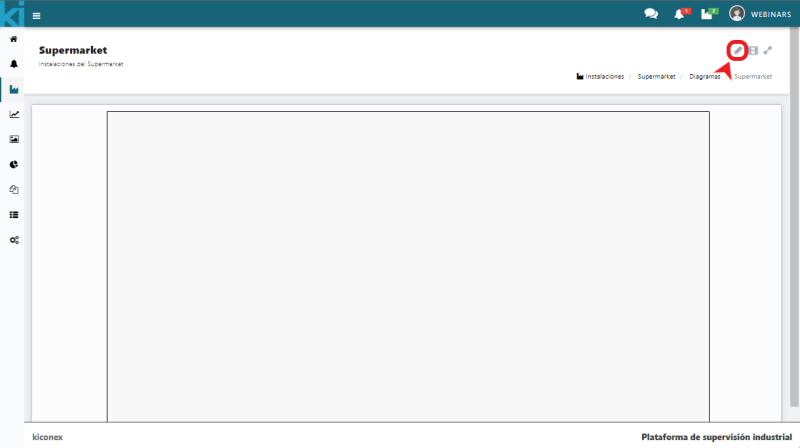
Layer configuration options
Layer configuration options The following icons are the diagram configuration icons:

The description of each icon from left to right is:
- Add image. Add a background image or an image to be used in some element.
- Add parameter. Menu to select variables of a control to display in the diagram.
- Add button. Used to add a button to the diagram to perform an action when clicked.
- Add object. Use it to add a shape or object to the diagram.
- Add text. Menu to include a text with its properties.
- Change background color. Used to change the background color of the diagram.
- Add multi-action button. Use it to create a button that executes several commands simultaneously when clicked.
- Export to PNG. Exports the diagram to a .png image format.
- Export to SVG. Export the diagram to an .svg image format.
- Show/hide grid. Select whether to show or not the grid.
Add image

By clicking on the icon a new new object panel appears. Here you can load the image to be used to represent in the diagram. For instance, a plan of the facility where all or some of the devices to be monitored are located, a circuit of an equipment, ect. among others.
Two tabs appear in this pop-up. The first tab Text will allow the user to name this image and configure the size. The text of this name will be displayed in the image the user uploads.
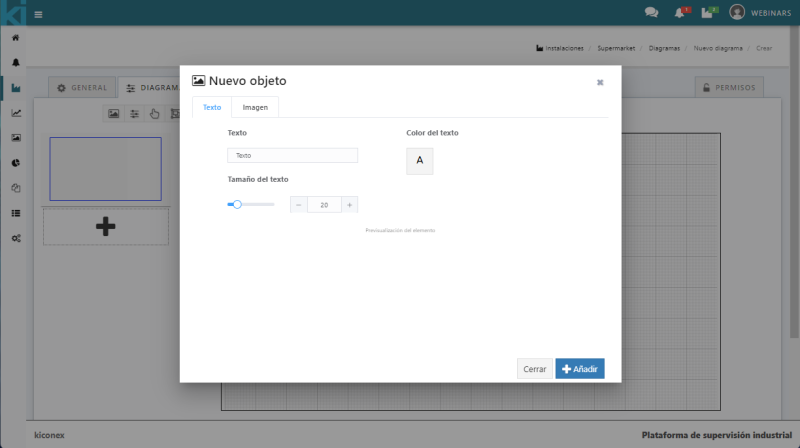
The next tab is Image, where the user can upload the image and set the file size. It can also preview the element.
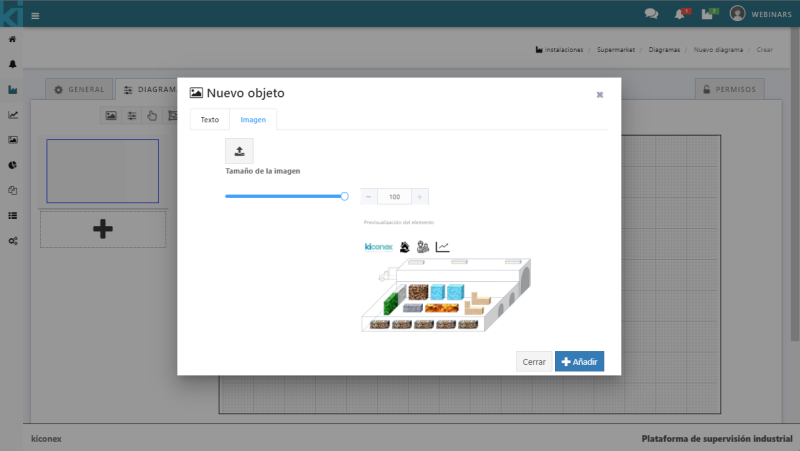
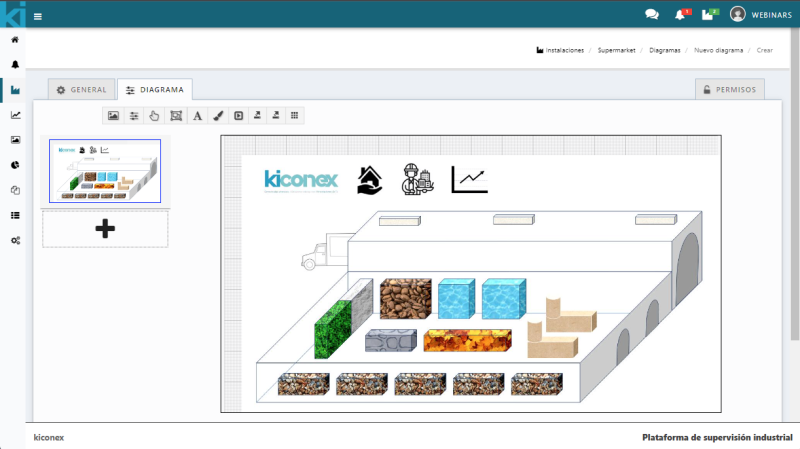
By clicking on the add button the image is uploaded to the diagram. Once the image is uploaded, the configuration box will close and the image will appear so that it can be placed in the desired position.
Add parameters
To add parameters, click on the icon shown below in the diagram configuration bar:

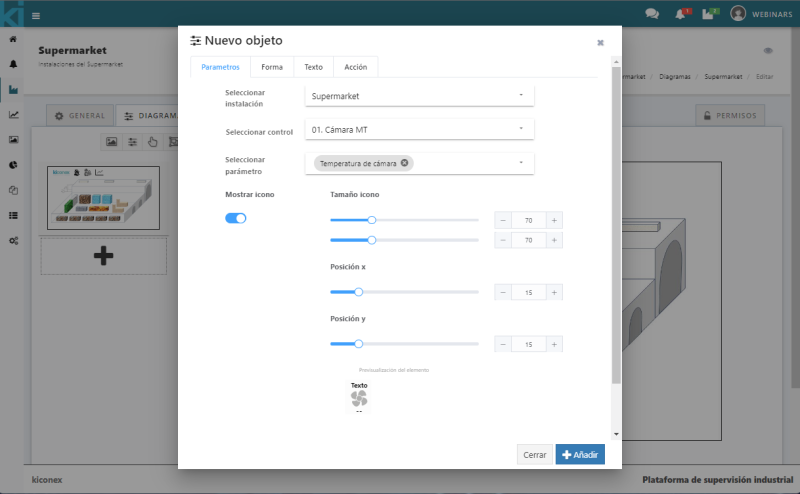
Once the icon is clicked, a configuration panel for this parameter will appear. It has four configuration tabs:
Parameters
Select facility: this drop-down menu automatically selects the facility to be worked on.
Select control: the control (machine or device to be monitored) must be selected.
Select parameter: the parameter to be displayed must be selected. That is, the variable to be monitored.
With the Show icon selector users indicate whether they want to display the icon (seeing a preview of the final format at the bottom of the pop-up). The size of the icon can be configured in the diagram, as well as the position of the X and Y axis.
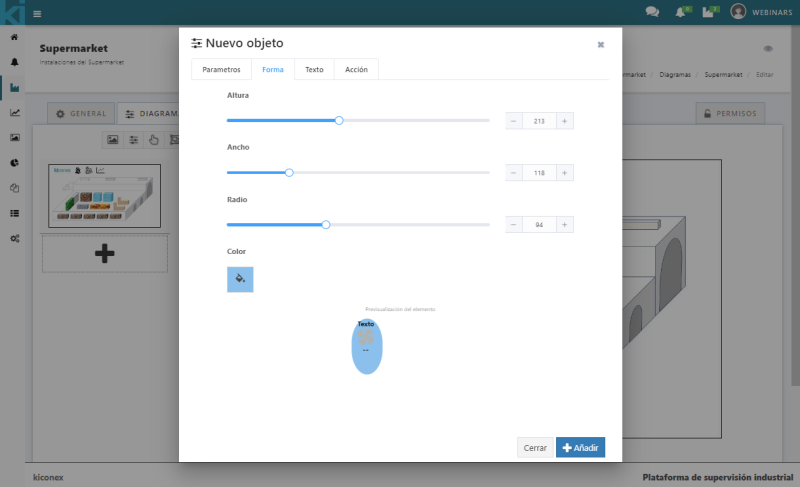
Shape
In this tab the user sets the height, width, radius and color of the area where it can access the graph of this parameter. The preview of the item will be displayed upon completion.
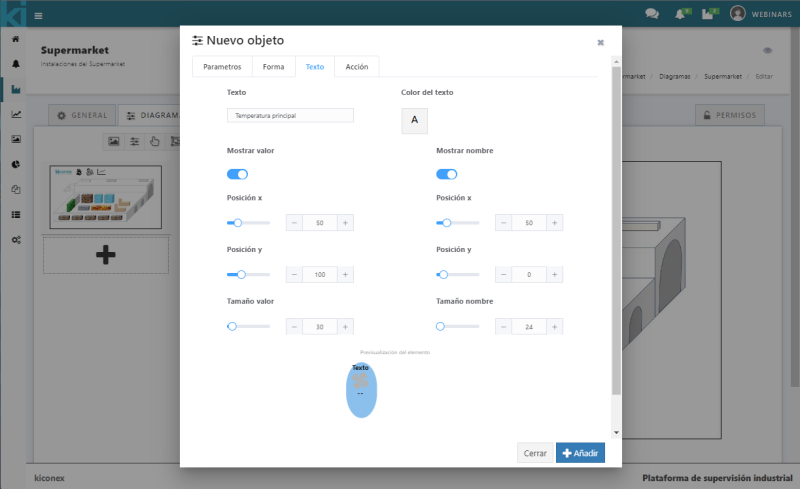
Text
The text input box is for entering the name to display that identifies the parameter. It can be the name of the room, the control or the machine, e.g.
The display of the value can be enabled or disabled and configured the X and Y position indicating the size at which the user wants to display the value. The preview of the item will be displayed upon completion.
Also the user can set the color text by clicking on the box where a color palette will appear.
The user can enable or disable the display of the name and configure the X and Y position indicating the size at which it wants to display the size of the name. The preview of the item will be displayed upon completion.
Action
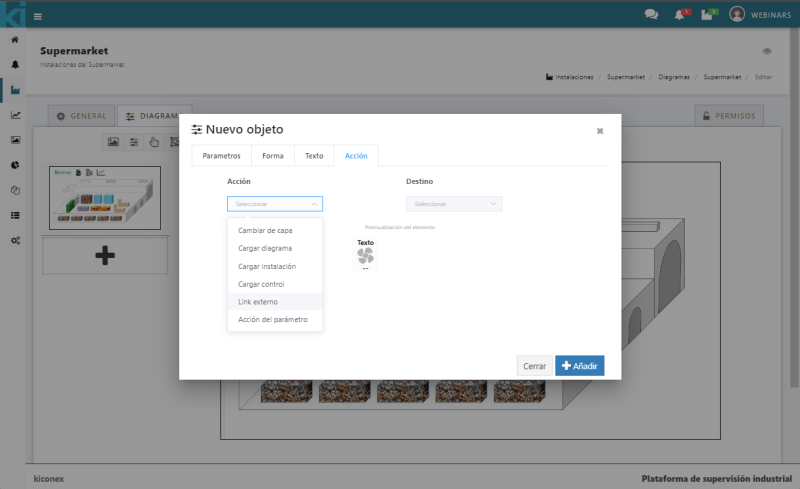
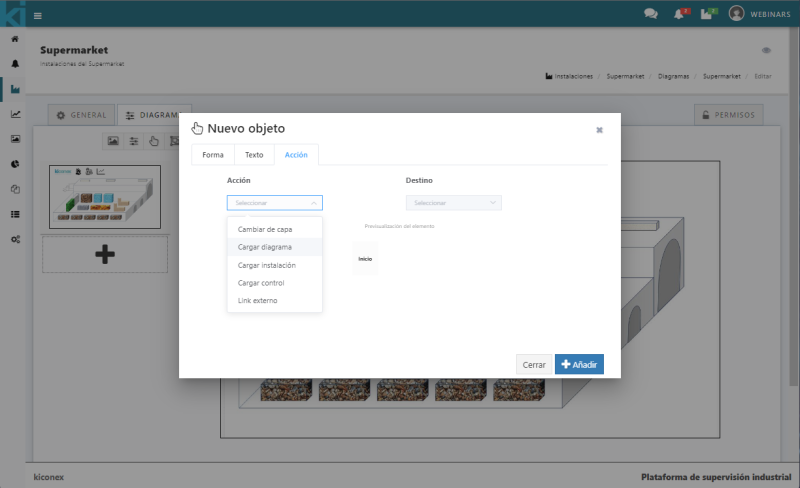
There is drop-down menu where the user can select the different actions that this parameter can perform as soon as it clicks on its area, it can change layer, load diagram, load facility, load control, go to an external link or simply the action of the parameter.
Next to it is the Destination setting that will indicate the possible options once the previous tab has been selected. The preview of the item will be displayed upon completion.
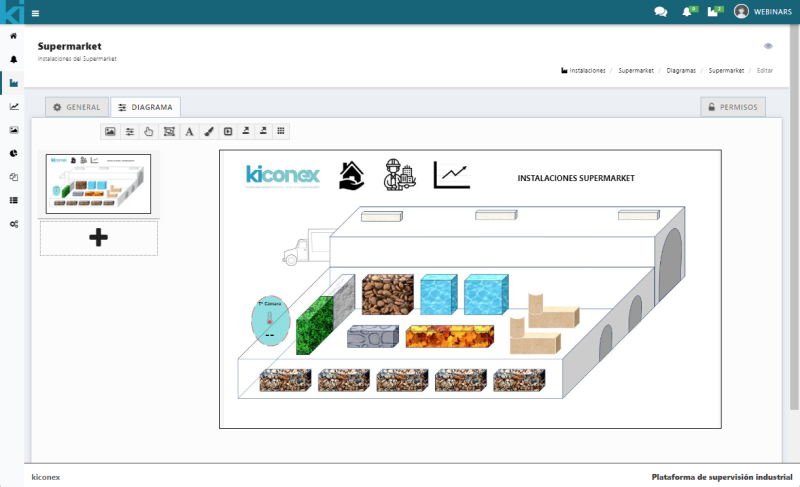
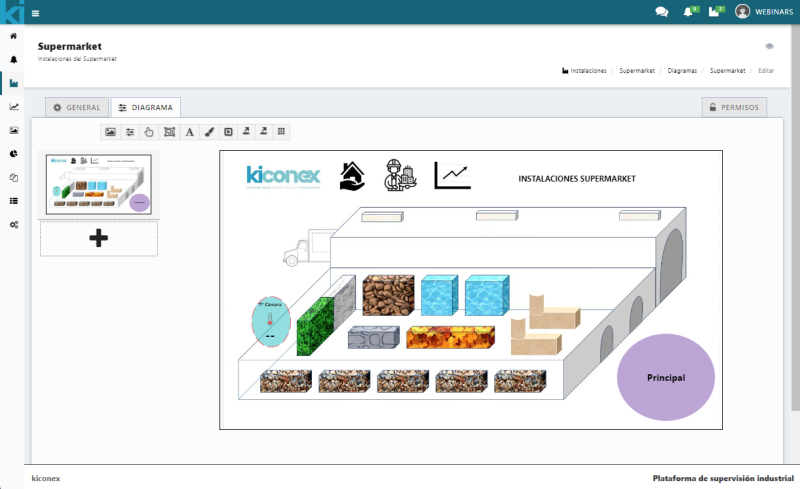
Once these configurations have been completed, click on "add" and this parameter will be added to the diagram, it can be placed wherever the user wishes.
Add button
To add a button, click on the icon shown below in the configuration bar of the diagram:

Clicking on the icon will open a configuration panel where it has three configuration tabs:
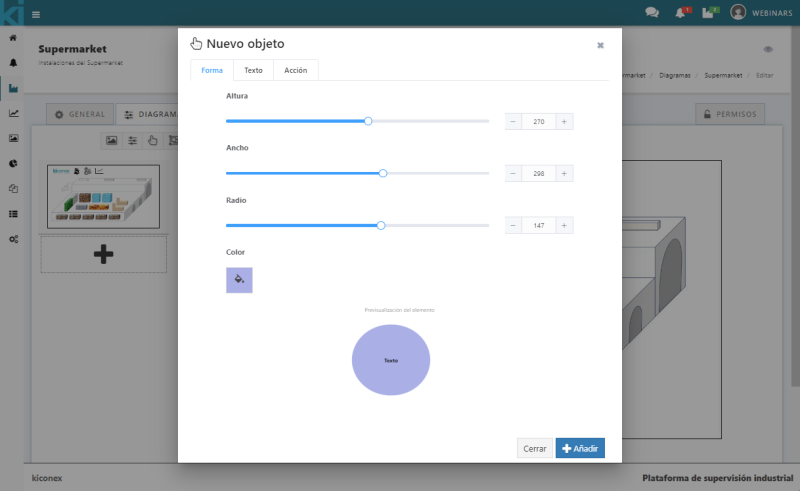
Shape
This tab is for setting the height, width, radius and color of the button area. The preview of the item will be displayed upon completion.
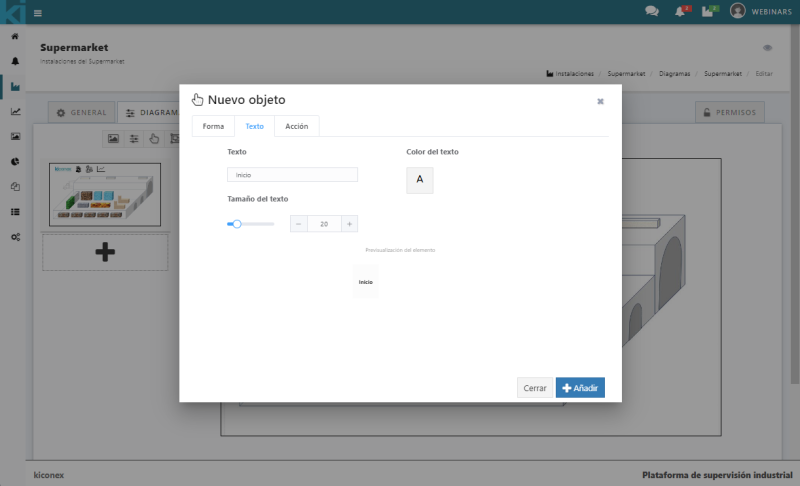
Text
Here is for setting the text, size and color. The preview of the item will be displayed upon completion.
Acción
Tiene un desplegable donde podrá seleccionar las diferentes acciones que puede realizar este parámetro en cuanto se haga click encima de su área, se puede cambiar de capa, cargar diagrama, cargar instalación, cargar control o ir a un link externo.
A su lado está la configuración Destino que indicará las opciones posibles una vez se haya seleccionado la pestaña anterior. Al final verás la previsualización del elemento.
Una vez terminadas estas configuraciones se debe hacer click en añadir y el botón se añadirá al diagrama, lo podrá situar donde desee.
Añadir objeto
Para añadir un objeto se debe pulsar sobre el icono que se muestra a continuación en la barra de configuración del diagrama:
Una vez pulsado el icono saldrá un panel de configuración donde tienes 2 pestañas de configuración:
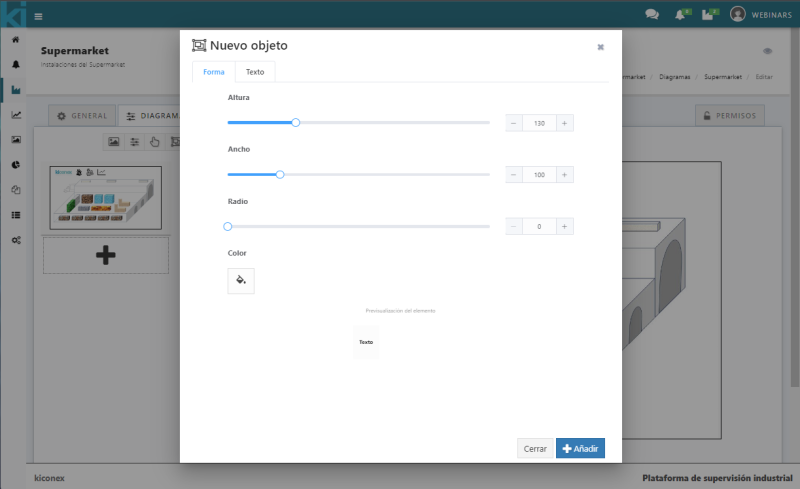
Forma
En esta pestaña se configura la altura, la achura, el radio y el color del área. Al final verá la previsualización del elemento.
Texto
En ella podrá configurar el texto, el tamaño y el color. Al final verá la previsualización del elemento.
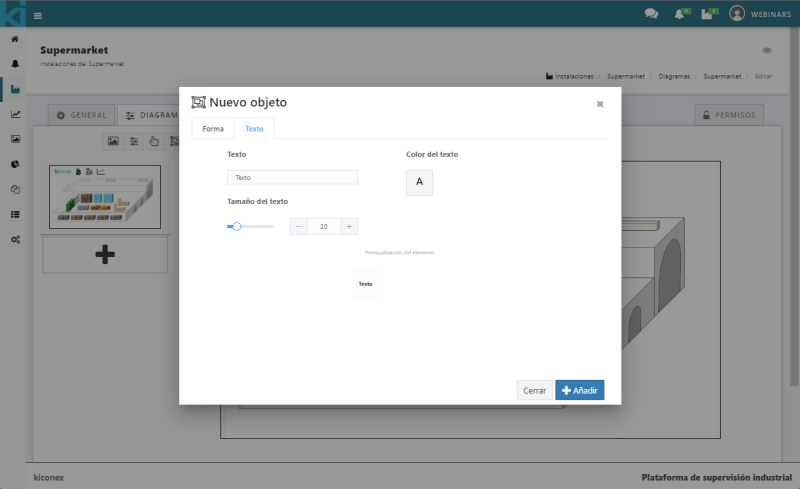
Una vez terminadas estas configuraciones se debe hacer click en añadir y el botón se añadirá al diagrama, lo podrá situar donde desee.
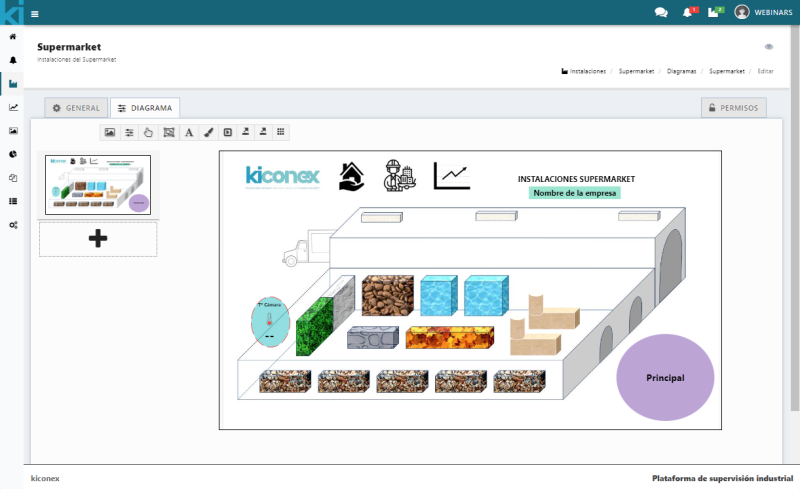
Añadir texto
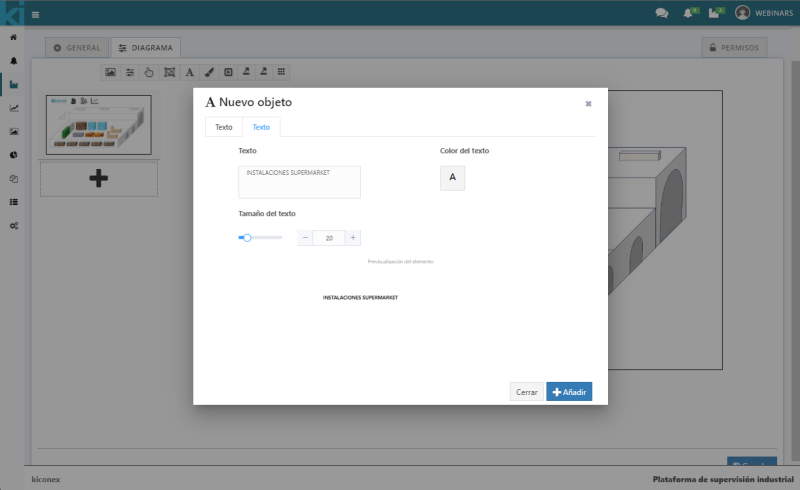
Para añadir texto se debe pulsar sobre el icono que se muestra a continuación en la barra de configuración del diagrama:

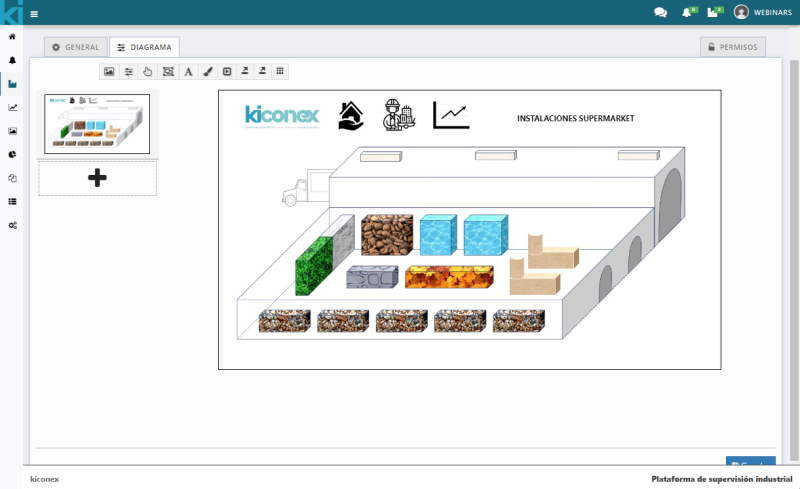
En ella podrá configurar un texto que necesite añadir al diagrama, el tamaño y el color. Al final verá la previsualización del elemento.
Cambiar color de fondo
Para cambiar el color de fondo se debe pulsar sobre el icono que se muestra a continuación en la barra de configuración del diagrama:

Una vez pulsado el icono saldrá una paleta de colores donde podrá configurar el color que desee, una vez configurado hacer click en Aceptar.
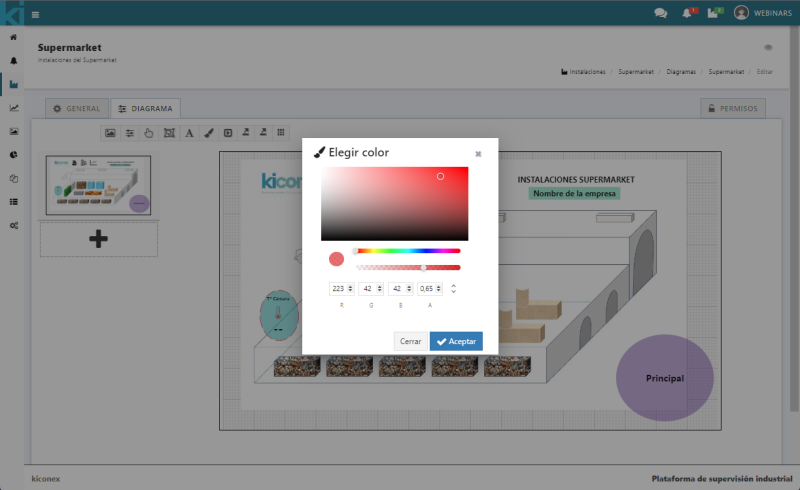
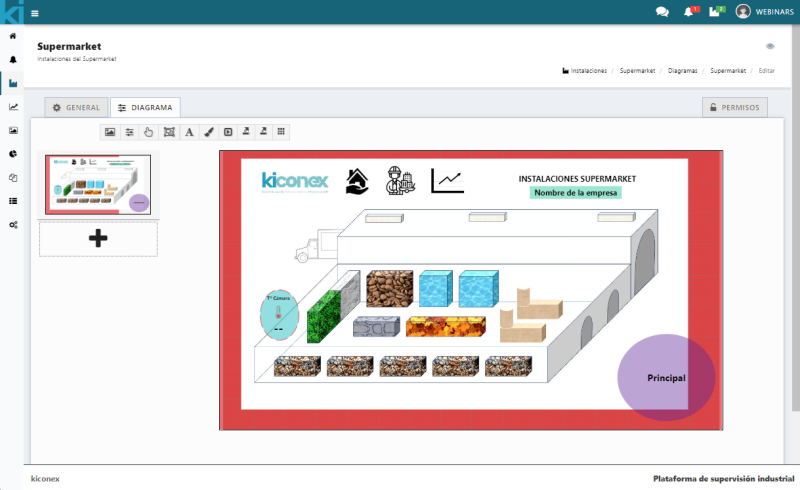
Nota: para este ejemplo se ha disminuido el tamaño del plano para poder así visualizar el cambio.
Añadir botón multi-acción
Para añadir un botón multi-acción se debe pulsar sobre el icono que se muestra a continuación en la barra de configuración del diagrama:

Una vez pulsado el icono saldrá un panel de configuración de este parámetro, tiene 4 pestañas de configuración:
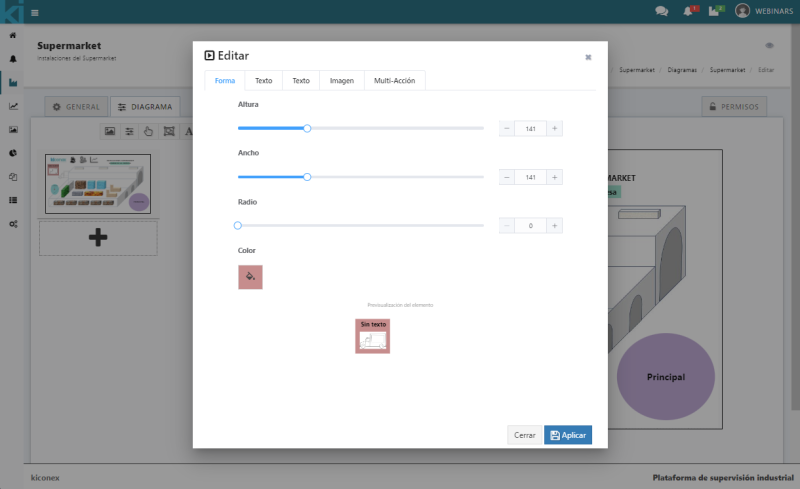
Forma
En esta pestaña se configura la altura, la achura, el radio y el color del área. Al final verá la previsualización del elemento.
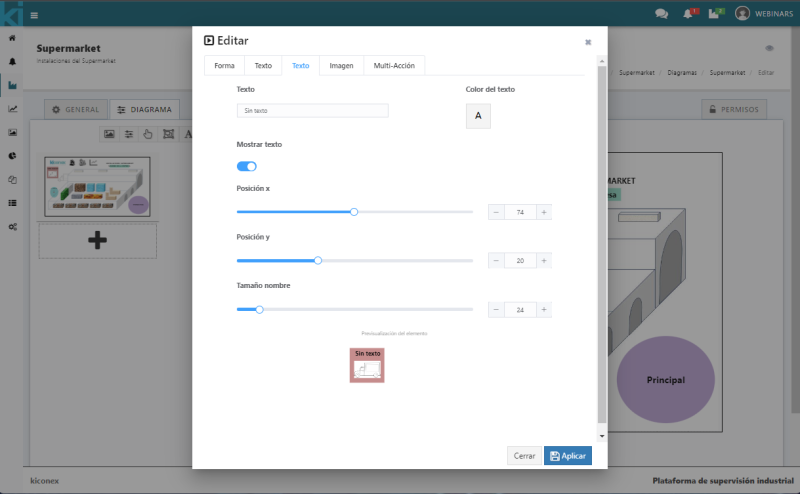
Texto
En ella podrá configurar el texto, el tamaño y el color. Al final verá la previsualización del elemento.
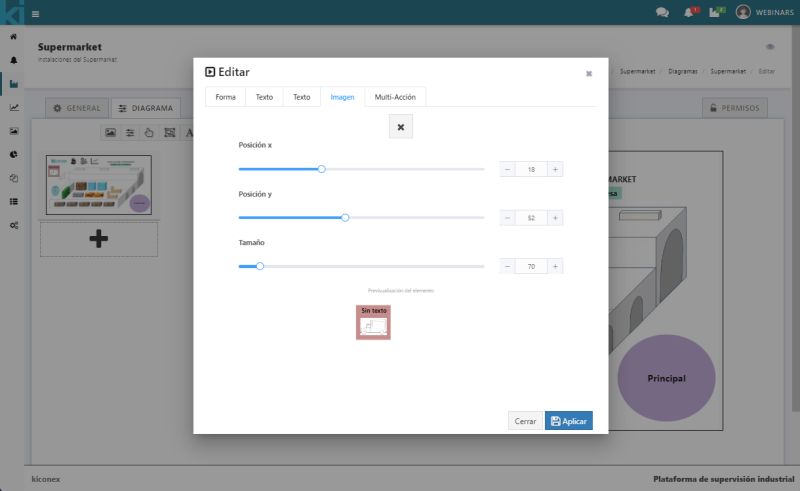
Imagen
Tiene la opción de subir una imagen representativa sobre el botón a añadir, configurar la posición del eje X e Y y su tamaño. Al final verá la previsualización del elemento.
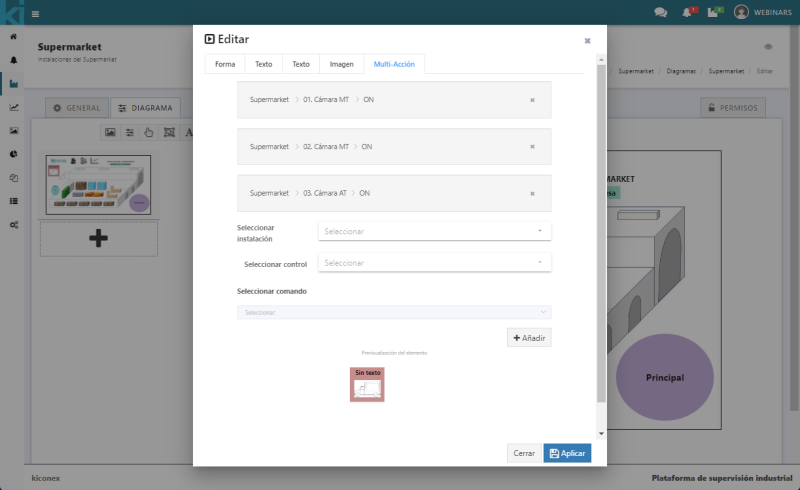
Multi-acción
Se debe seleccionar la instalación el control y el o los comandos que vas a representar en el diagrama, una vez seleccionados pulsar añadir en la opción de debajo de la selección del comando, se pueden añadir varios a la vez por lo que se debe pulsar añadir en azul para añadir las selecciones una vez configuradas.
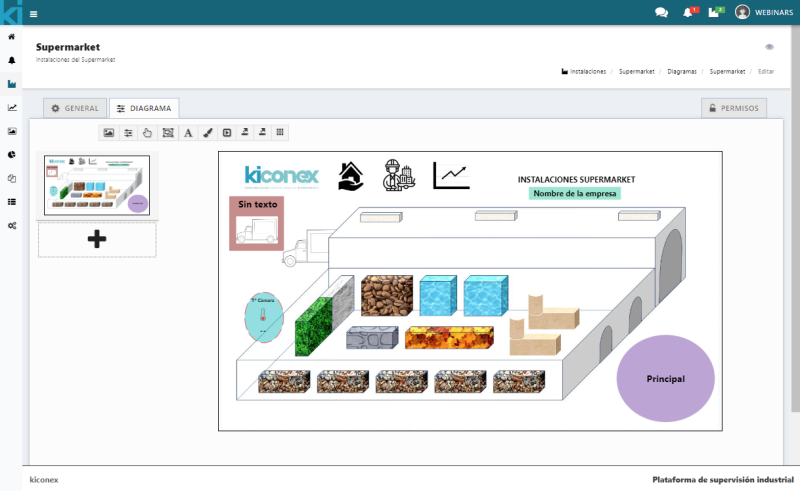
Visualización del botón multi-acción en diagramas:
Exportar a PNG
Para exportar a png se debe pulsar sobre el icono que se muestra a continuación en la barra de configuración del diagrama:

Una vez pulsado el icono se descargará automáticamente una imagen en formato png, lo podrá visualizar en la barra inferior o en la carpeta de descargas.
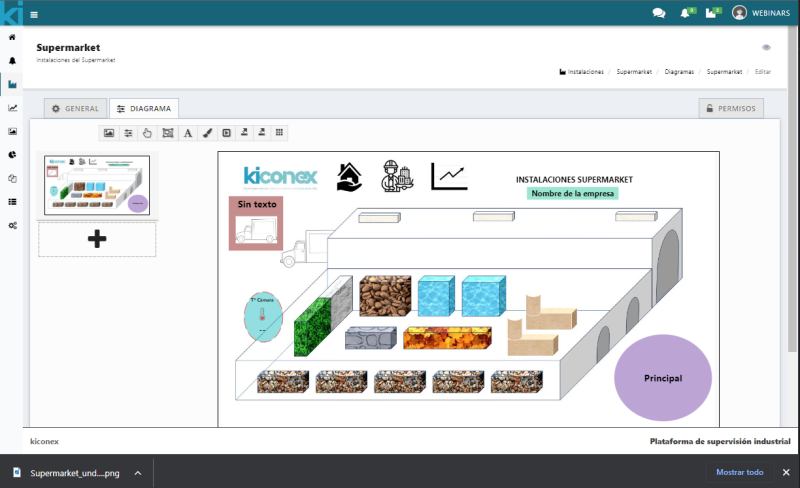
Se descargará una imagen del diseño del diagrama que se haya realizado en formato png.
Exportar a SVG
Para exportar a SVG se debe pulsar sobre el icono que se muestra a continuación en la barra de configuración del diagrama:

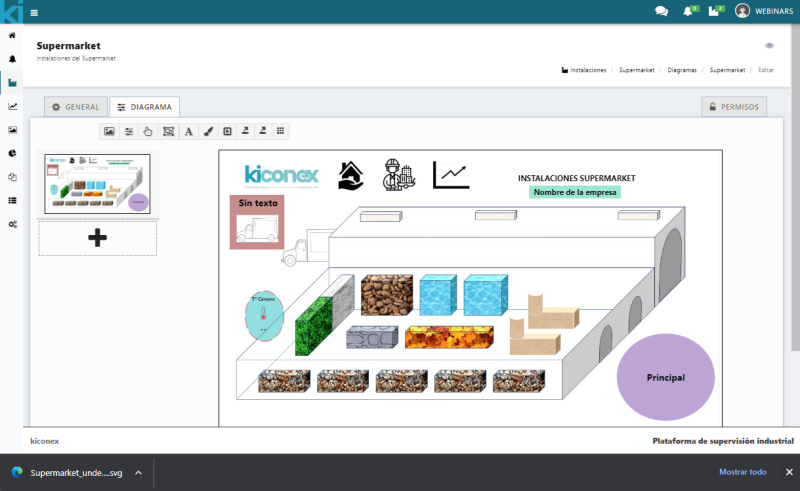
Se descargará una imagen del diseño del diagrama que se haya realizado en formato SVG.
Mostrar/quitar Grid
Para mostrar/quitar Grid se debe pulsar sobre el icono que se muestra a continuación en la barra de configuración del diagrama:

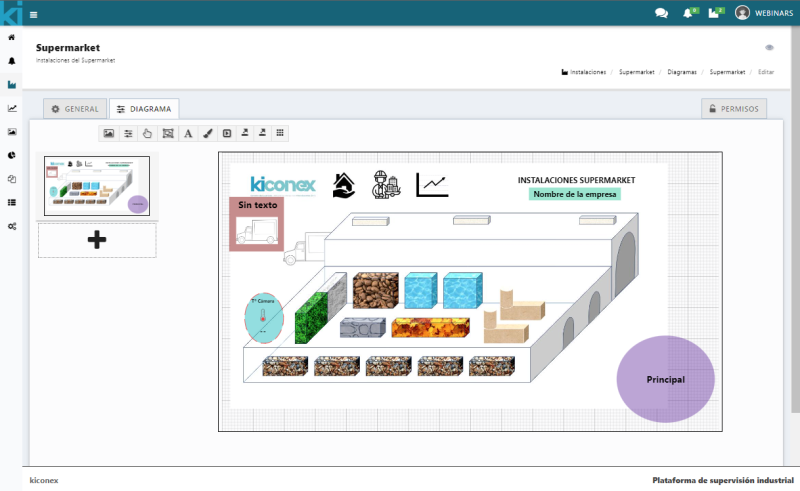
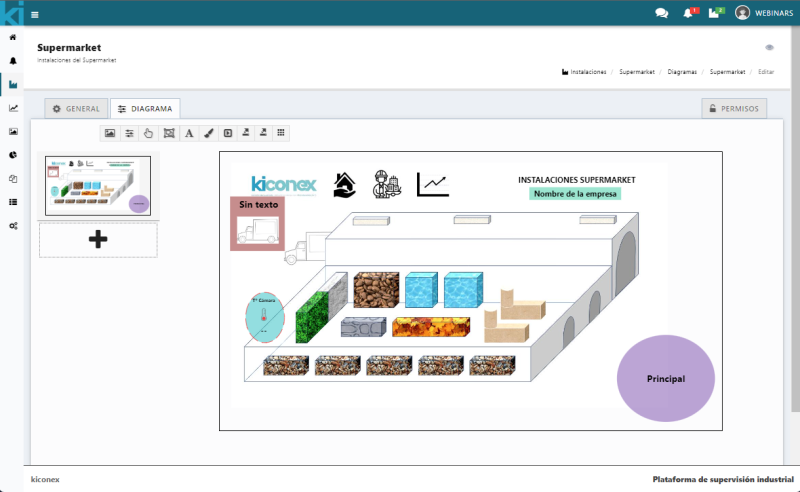
Nota: para este ejemplo se ha disminuido el tamaño del plano para poder así visualizar el cambio.
Adición de capas
Un diagrama puede estar compuesto por una o varias capas. Para añadir una capa al diagrama se debe hacer click en el botón "+" ubicado en el menú lateral izquierdo..
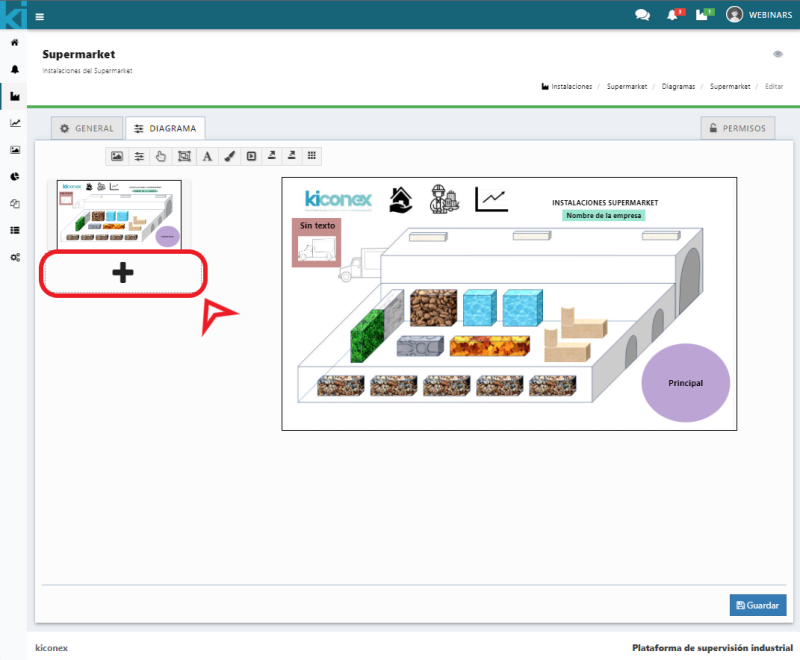
Se desplegará el pop-up principal de configuración de la capa, tendrá:
Nombre de la capa
En este apartado se deberá configurar el nombre de la capa.
Capa principal
Se debe configurar si será la capa principal o no, bastaría con marcar en el recuadro para que se habilite o deshabilite según la necesidad.
Configuración para presentación
Indica "Mostrar". El diagrama funciona como una presentación por lo que se puede configurar qué capas se desean visualizar y las que no.
En caso de seleccionar la capa para que se visualice en modo presentación se debe configurar el tiempo en el que se desea que permanezca.
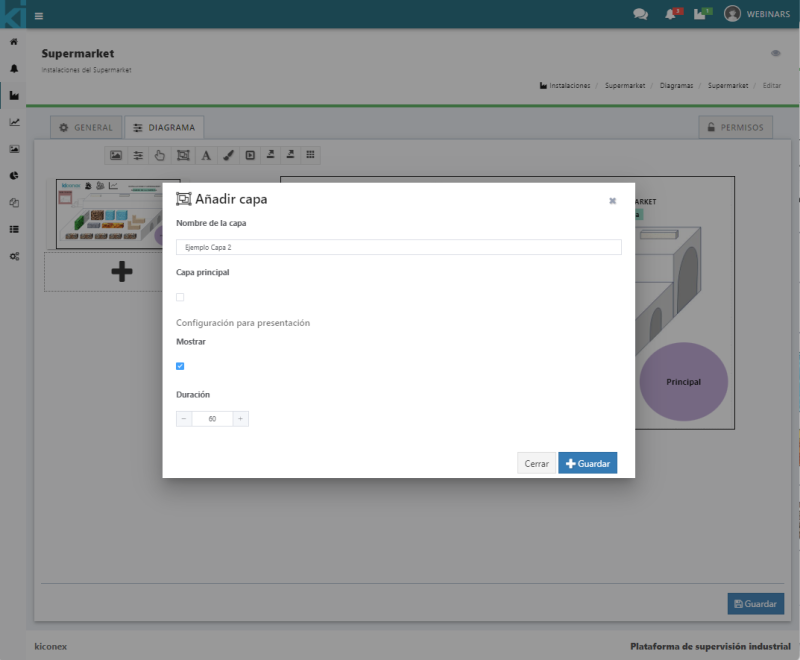
Una vez configurada la información anterior se debe pulsar "Guardar" y nuevamente "Guardar" para terminar de configurar sobre el diagrama.
Permisos
El funcionamiento de los permisos lo podrá visualizar más detalladamente en el siguiente enlace
Para que los usuarios de la instalación vean el diagrama creado se les debe asignar dichos permisos, los permisos se heredan de los permisos asignados en la instalación por lo que si es necesario dar menos o más permisos se debe revisar.
Pulsar "Guardar" una vez configurado para que se trasladen los cambios.


