Diferencia entre revisiones de «Translations:Graphics/5/en»
De wiki.kiconex
Sin resumen de edición |
Sin resumen de edición |
||
| Línea 1: | Línea 1: | ||
== Overlapping data from several variables on the same graph == | == Overlapping data from several variables on the same graph == | ||
It is possible to overlap the data of different variables on the same graph. To do this, use the button with the "pushpin" symbol: | It is possible to overlap the data of different variables on the same graph. To do this, use the button with the "pushpin" symbol: | ||
[[Archivo:CHINCHETA G.png|alt=graphic blue pushpin|centro|miniatureimage| | [[Archivo:CHINCHETA G.png|alt=graphic blue pushpin|centro|miniatureimage|800x800px|By marking the '''pin''' symbol in '''blue''' color, the graph is not lost when you close and reopen the data history of another variable]] | ||
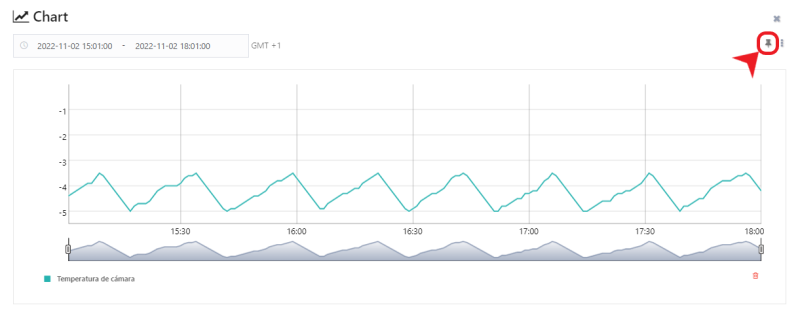
The process for overlapping several graphs is shown below: | The process for overlapping several graphs is shown below: | ||
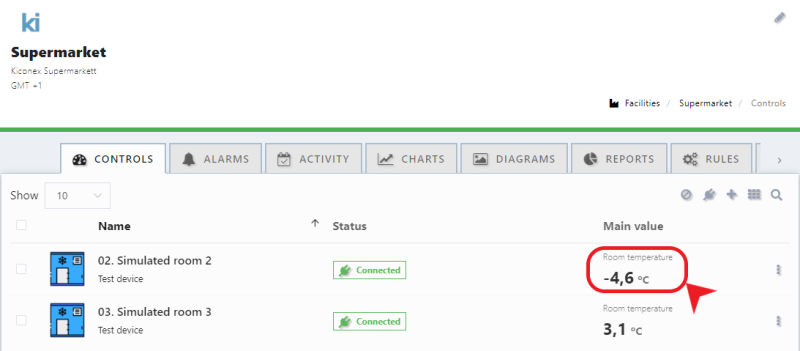
[[Archivo:FIRST VALUE CHART.png|alt=first_chart_value|centro|miniatureimage|800px|1 - Open the '''first variable''' graph.]] | [[Archivo:FIRST VALUE CHART.png|alt=first_chart_value|centro|miniatureimage|800px|1 - Open the '''first variable''' graph.]] | ||
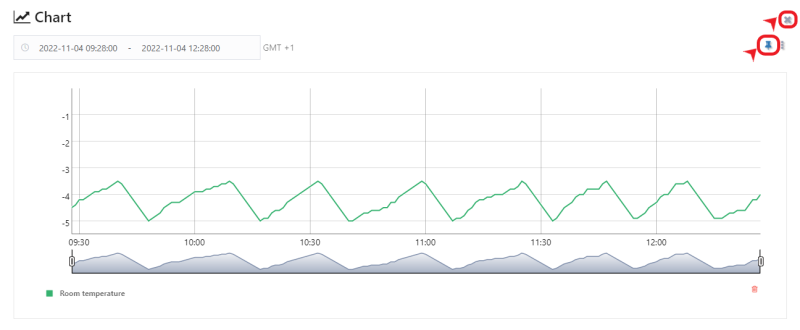
[[Archivo:CHINCHETA AZUL AND CLOSE.png|alt=blue pushpin|centro|miniatureimage| | [[Archivo:CHINCHETA AZUL AND CLOSE.png|alt=blue pushpin|centro|miniatureimage|800x800px|2 - Mark the '''pushpin''' in '''blue''' and close the graph.]] | ||
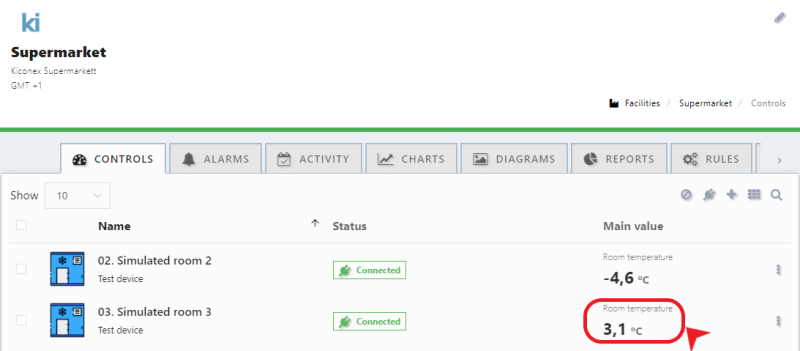
[[Archivo:SECOND VALUE CHART.png|alt=second_chart_value|centro|miniatureimage| | [[Archivo:SECOND VALUE CHART.png|alt=second_chart_value|centro|miniatureimage|800x800px|3 - Open the graph of the second variable.]] | ||
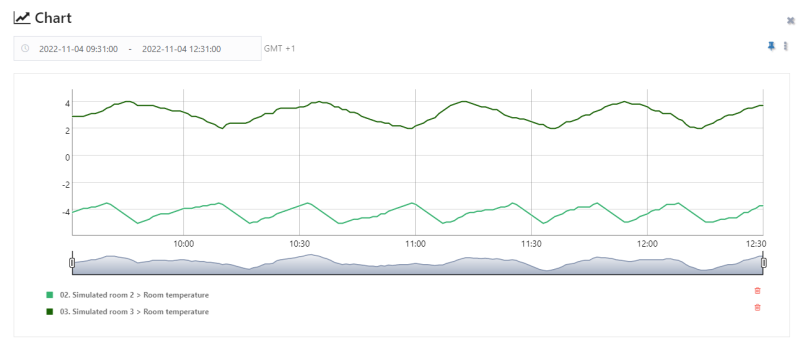
[[Archivo:GRAPH WITH TWO VALUES.png|alt=Graph with two values|centro|miniatureimag| | [[Archivo:GRAPH WITH TWO VALUES.png|alt=Graph with two values|centro|miniatureimag|800x800px|4 - When the '''pushpin''' is marked in '''blue''', a graph is opened with the new variable and the previous graph is maintained.]] | ||
Revisión actual - 07:02 10 abr 2024
Overlapping data from several variables on the same graph
It is possible to overlap the data of different variables on the same graph. To do this, use the button with the "pushpin" symbol:
The process for overlapping several graphs is shown below:
