Diferencia entre revisiones de «Translations:Graphics/6/en»

De wiki.kiconex
Sin resumen de edición
 
Línea 2: Línea 2:
There is the possibility to permanently save the graph, in order to have it accessible from the list of graphs of the user (left side menu) or from the list of graphs of the facility(menu "GRAPHICS" inside the facility). The following images show a graph with the data of several variables and the saving process:
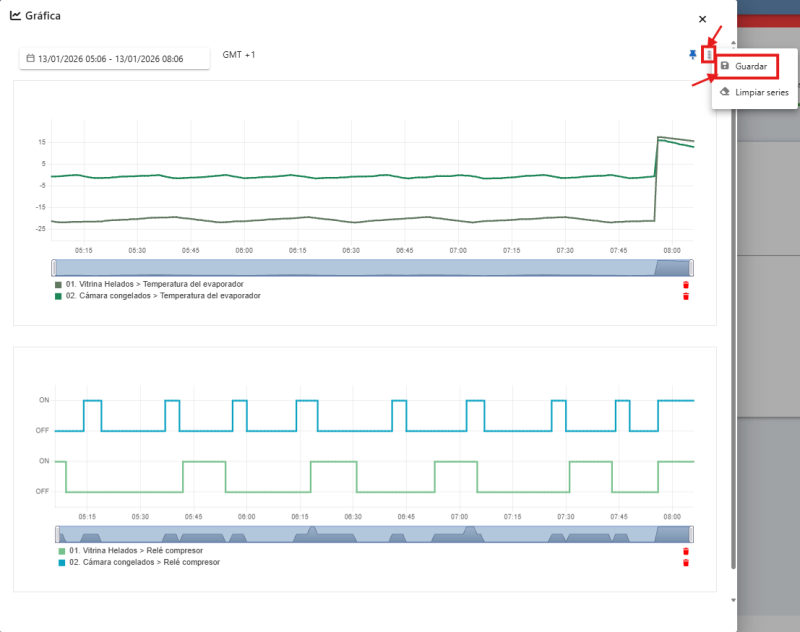
[[Archivo:SAVE GRAPH BTN.png|alt=Save graph button|centro|miniatureimage|800px|1 - Click on '''Save''' option in the graph that opens from the control view.]]
[[Archivo:SAVE GRAPH BTN.png|alt=Save graph button|centro|miniatureimage|800px|1 - Click on '''Save''' option in the graph that opens from the control view.]]
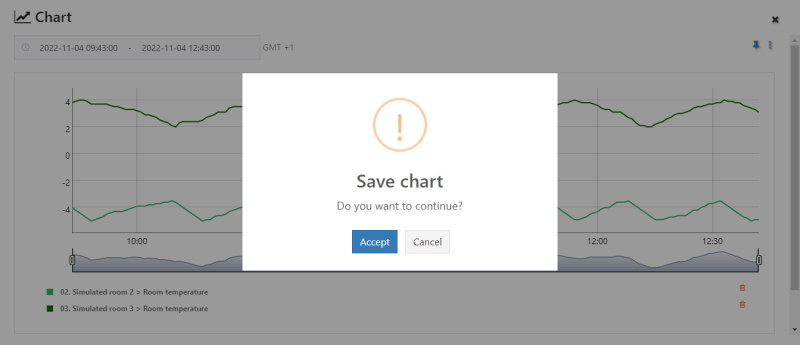
[[Archivo:SAVE CHART CONFIRMATION.png|alt=Save graph confirmation|centro|miniatureimage|800px|2 - Confirm creation of the graph.]]
[[Archivo:SAVE CHART CONFIRMATION.png|alt=Save graph confirmation|centro|miniatureimage|800x800px|2 - Confirm creation of the graph.]]
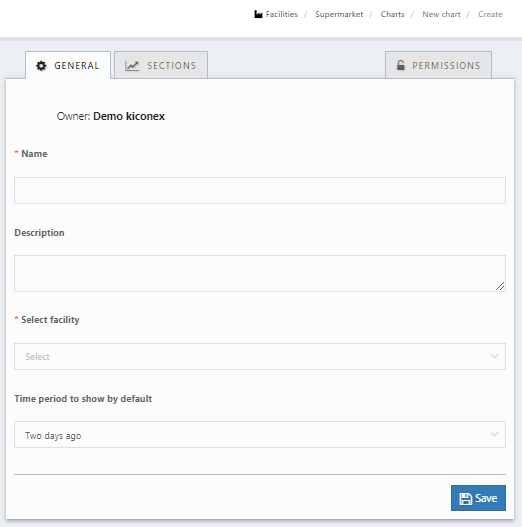
[[Archivo:GENERAL DATA NEW GRAPH.png|alt=General data new graph|centro|miniatureimage|800px|3 - Specify general data of the graph: '''name''', '''description''', '''facility''' to which it belongs and '''period of time that will be displayed by default''' when accessing it.]]
[[Archivo:GENERAL DATA NEW GRAPH.png|alt=General data new graph|centro|miniatureimage|800x800px|3 - Specify general data of the graph: '''name''', '''description''', '''facility''' to which it belongs and '''period of time that will be displayed by default''' when accessing it.]]
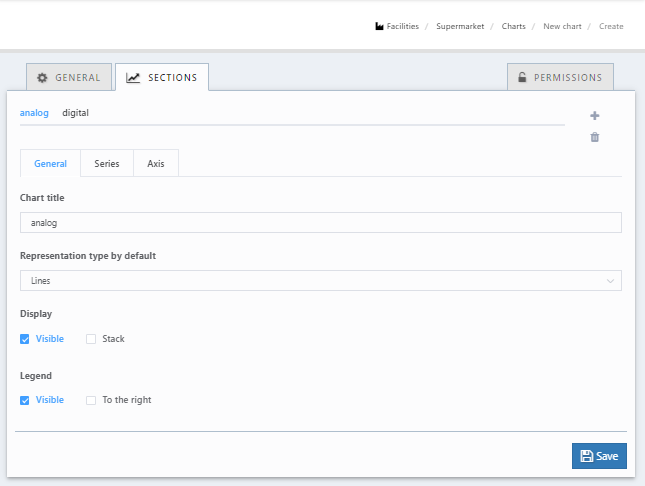
[[Archivo:SECTION DATA NEW GRAPH.png|alt=Section data new graph|centro|miniatureimage|800px|4 - The variables that appeared in the graph are shown in '''"SECTIONS"''' tab. Here, it is able to adjust how you want to see the data curves. The saving process is completed by clicking on the blue '''"SAVE"''' button.]]
[[Archivo:SECTION DATA NEW GRAPH.png|alt=Section data new graph|centro|miniatureimage|800x800px|4 - The variables that appeared in the graph are shown in '''"SECTIONS"''' tab. Here, it is able to adjust how you want to see the data curves. The saving process is completed by clicking on the blue '''"SAVE"''' button.]]

Revisión actual - 07:03 10 abr 2024

Información acerca del mensaje (contribuir)
Este mensaje no tiene documentación. Si sabes dónde o cómo se usa este mensaje, puedes ayudar a los otros traductores añadiendo documentación a este mensaje.
Definición del mensaje (Graphics)
== Guardar de forma permanente una gráfica ==
Existe la posibilidad de guardar de forma permanente la gráfica, con el objetivo de tenerla accesible desde la lista de gráficas del usuario (menú lateral izquierdo) o desde la lista de gráficas de la instalación (menú "GRÁFICAS" dentro de la instalación). En las siguiente imágenes, se muestra una gráfica con los datos de varias variables, y el proceso de guardado:
[[Archivo:SAVE GRAPH BTN.png|alt=SAVE_GRAPH_BTN|centro|miniaturadeimagen|800x800px|1 - Clic en la opción '''GUARDAR''' de la gráfica que se abre desde la vista del control]]
[[Archivo:SAVE CHART CONFIRMATION.png|alt=SAVE_CHART_CONFIRMATION|centro|miniaturadeimagen|800x800px|2 - Confirmar la creación de la gráfica]]
[[Archivo:GENERAL DATA NEW GRAPH.png|alt=GENERAL_DATA_NEW_GRAPH|centro|miniaturadeimagen|808x808px|3 - Especificar datos generales de la gráfica: '''nombre''', '''descripción''', '''instalación''' a la que pertenece y '''periodo de tiempo que mostrará por defecto''' al acceder]]
[[Archivo:SECTION DATA NEW GRAPH.png|alt=SECTION_DATA_NEW_GRAPH|centro|miniaturadeimagen|800x800px|4 - En la pestaña "'''SECCIONES'''", se puede ver que ya se han añadido las variables que aparecían en la gráfica. Desde esta pestaña, se puede ajustar cómo se desean ver las curvas de datos. Se termina el proceso de guardado haciendo clic en el botón azul '''GUARDAR''']]

Saving a graph permanently =

There is the possibility to permanently save the graph, in order to have it accessible from the list of graphs of the user (left side menu) or from the list of graphs of the facility(menu "GRAPHICS" inside the facility). The following images show a graph with the data of several variables and the saving process:

Save graph button
1 - Click on Save option in the graph that opens from the control view.
Save graph confirmation
2 - Confirm creation of the graph.
General data new graph
3 - Specify general data of the graph: name, description, facility to which it belongs and period of time that will be displayed by default when accessing it.
Section data new graph
4 - The variables that appeared in the graph are shown in "SECTIONS" tab. Here, it is able to adjust how you want to see the data curves. The saving process is completed by clicking on the blue "SAVE" button.