Diferencia entre revisiones de «Graphics/en»
Página creada con «== Access to the data history of a variable == It is easily open the data history of a variable, wherever the variable is visible:» |
Página creada con «== Overlapping data from several variables on the same graph == It is possible to overlap the data of different variables on the same graph. To do this, use the button with the "pushpin" symbol: alt=graphic blue pushpin|centro|miniatureimage|780x780px|By marking the '''pin''' symbol in '''blue''' color, the graph is not lost when you close and reopen the data history of another variable The process for overlapping several graphs is shown be…» |
||
| Línea 20: | Línea 20: | ||
== Overlapping data from several variables on the same graph == | |||
It is possible to overlap the data of different variables on the same graph. To do this, use the button with the "pushpin" symbol: | |||
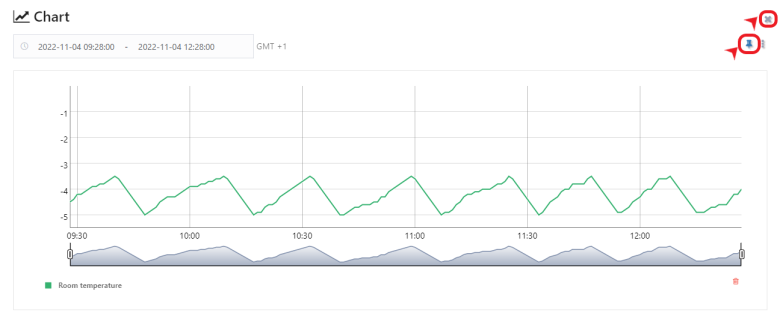
[[Archivo:CHINCHETA G.png|alt=graphic blue pushpin|centro|miniatureimage|780x780px|By marking the '''pin''' symbol in '''blue''' color, the graph is not lost when you close and reopen the data history of another variable]] | |||
[[Archivo:CHINCHETA G.png|alt= | The process for overlapping several graphs is shown below: | ||
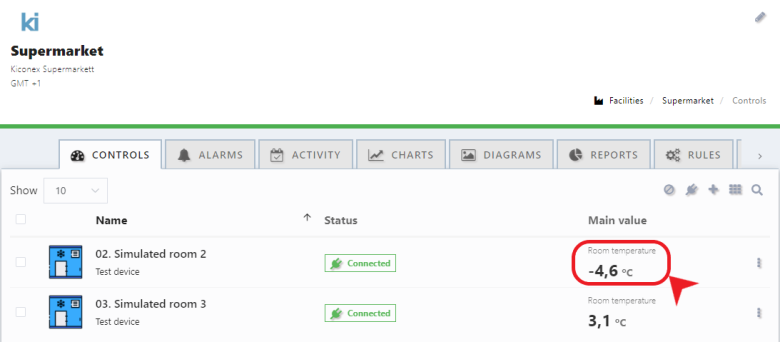
[[Archivo:FIRST VALUE CHART.png|alt=first_chart_value|centro|miniatureimage|780x780px|1 - Open the '''first variable''' graph.]] | |||
[[Archivo:FIRST VALUE CHART.png|alt=first_chart_value|centro| | [[Archivo:CHINCHETA AZUL AND CLOSE.png|alt=blue pushpin|centro|miniatureimage|780x780px|2 - Mark the '''pushpin''' in '''blue''' and close the graph.]] | ||
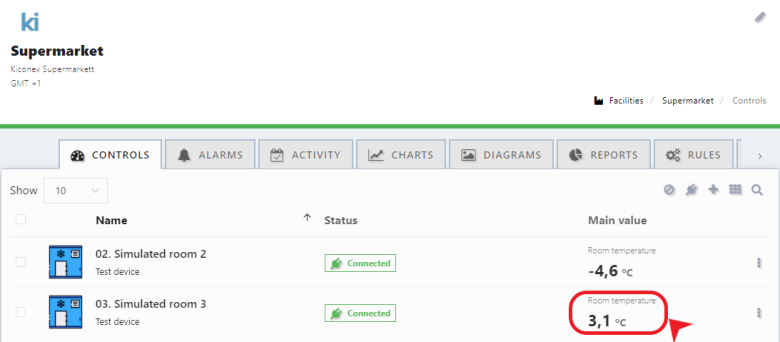
[[Archivo:CHINCHETA AZUL AND CLOSE.png|alt= | [[Archivo:SECOND VALUE CHART.png|alt=second_chart_value|centro|miniatureimage|780x780px|3 - Open the graph of the second variable.]] | ||
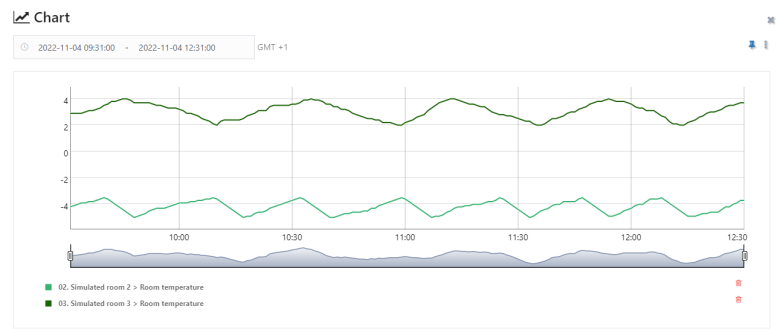
[[Archivo:SECOND VALUE CHART.png|alt=second_chart_value|centro| | [[Archivo:GRAPH WITH TWO VALUES.png|alt=Graph with two values|centro|miniatureimag|780x780px|4 - When the '''pushpin''' is marked in '''blue''', a graph is opened with the new variable and the previous graph is maintained.]] | ||
[[Archivo:GRAPH WITH TWO VALUES.png|alt= | |||
Revisión del 15:10 14 sep 2023
=Graphics This is one of the most important modules of myKiconex platform. With this tool, it is possible to make temporary graphical representations of analog/digital variables and states. The module allows data comparisons of different controls and facilities, as well as the creation of preconfigured graphs for easier access to historical behavioral data.
In myKiconex platform, data can be saved over time (see section on control saving interval configuration). These data can be visualized in a graph to analyze the behavior of a control over time.
Access to the data history of a variable
It is easily open the data history of a variable, wherever the variable is visible:
- Facility controls tab
- Simple control view
- Extended control view
- Facility diagram
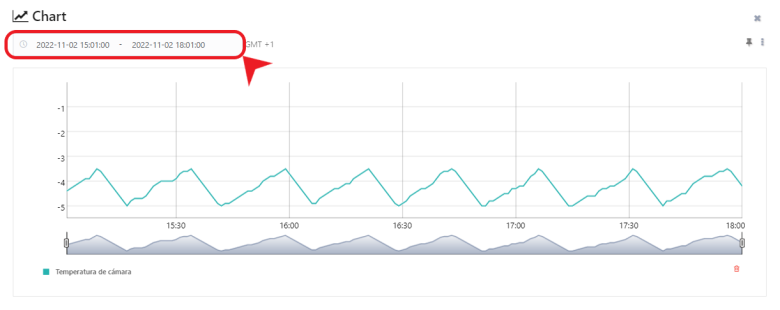
Graph configuration points
The graph looks as follows:
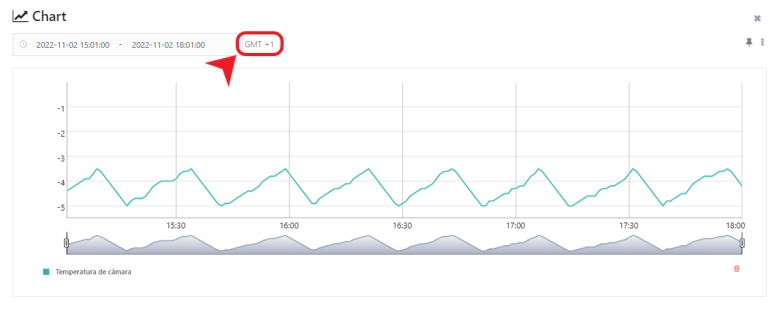
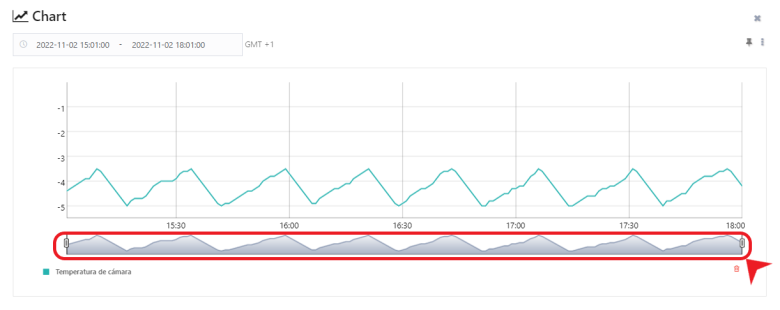
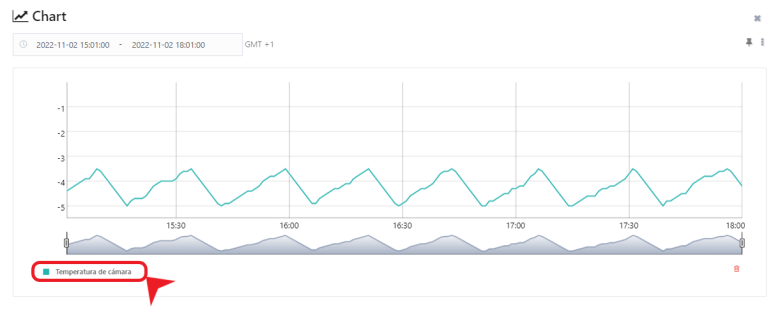
Overlapping data from several variables on the same graph
It is possible to overlap the data of different variables on the same graph. To do this, use the button with the "pushpin" symbol:
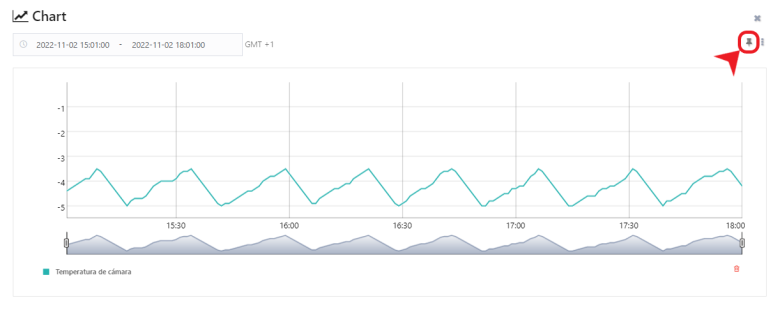
The process for overlapping several graphs is shown below:
Guardar de forma permanente una gráfica
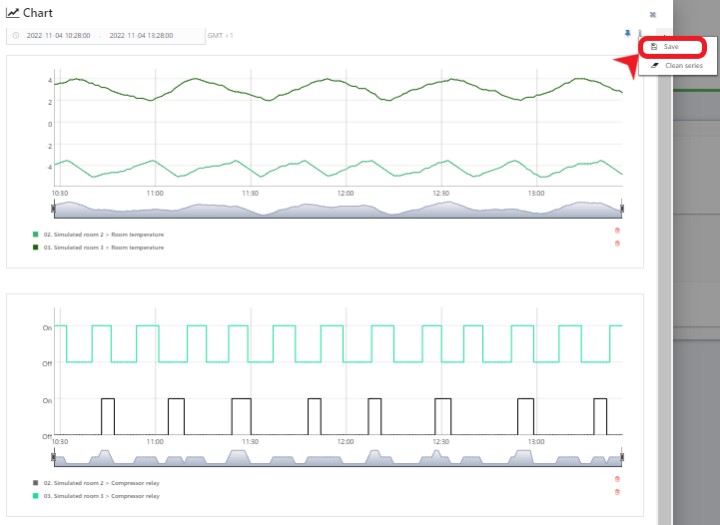
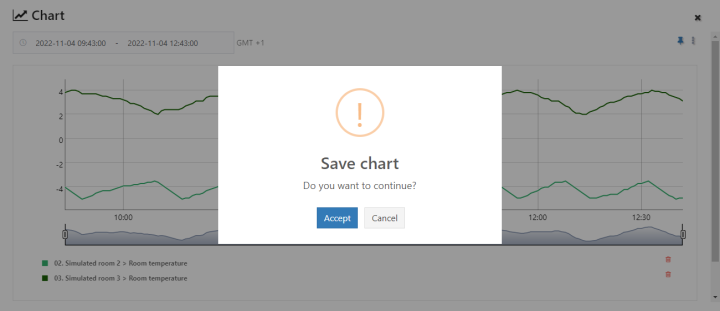
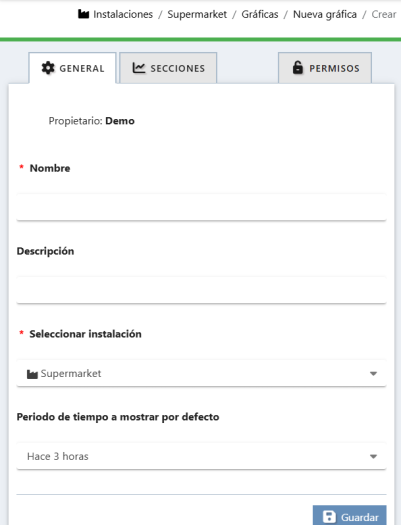
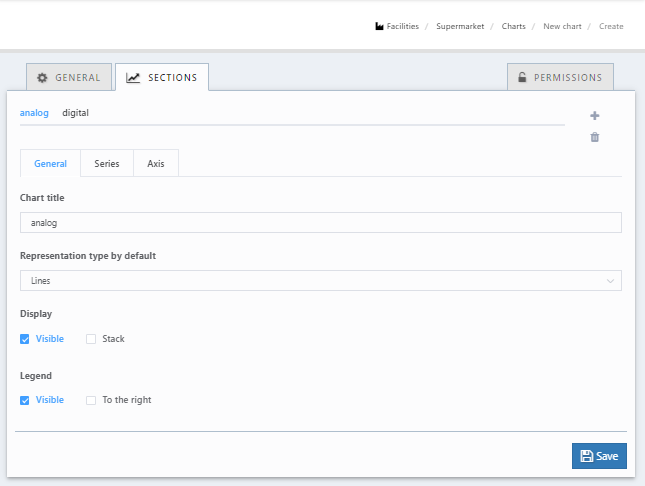
Existe la posibilidad de guardar de forma permanente la gráfica, con el objetivo de tenerla accesible desde la lista de gráficas del usuario (menú lateral izquierdo) o desde la lista de gráficas de la instalación (menú "GRÁFICAS" dentro de la instalación). En las siguiente imágenes, se muestra una gráfica con los datos de varias variables, y el proceso de guardado:
Descarga de los datos de una gráfica
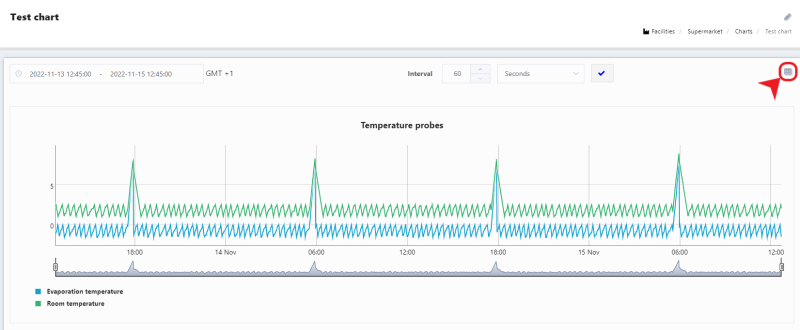
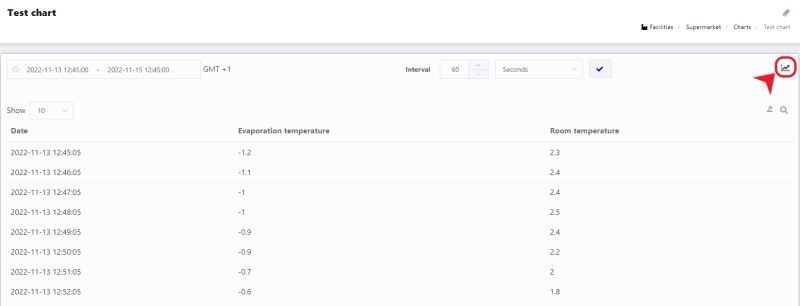
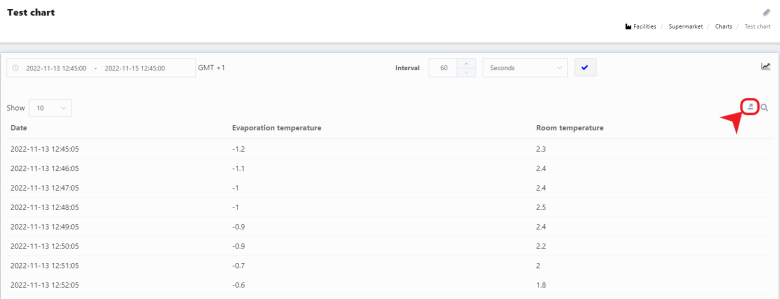
Tras guardar una gráfica siguiendo los pasos del punto anterior, existe la posibilidad de descargar el histórico de datos en una tabla excel. En las imágenes siguientes se muestra el icono que permite conmutar entre la vista de gráfica o la vista de la tabla de datos:

