Translations:Graphics/5/en
De wiki.kiconex
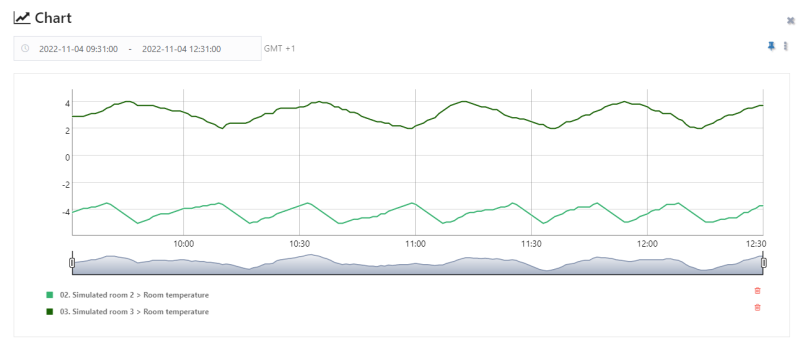
Overlapping data from several variables on the same graph
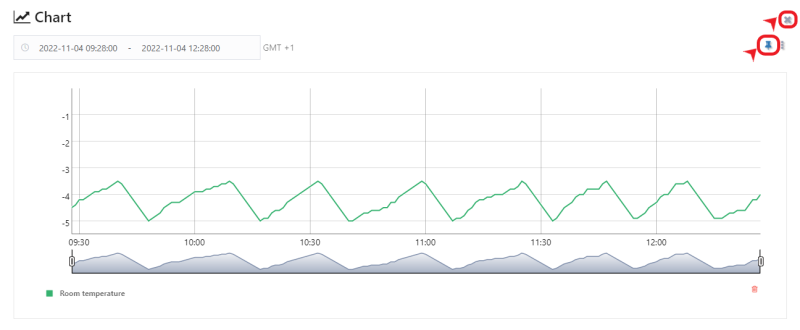
It is possible to overlap the data of different variables on the same graph. To do this, use the button with the "pushpin" symbol:
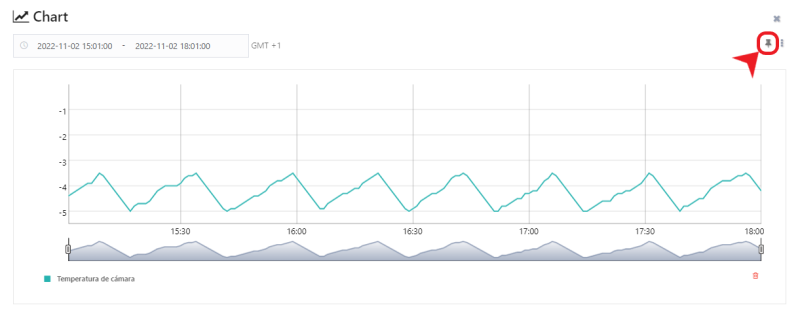
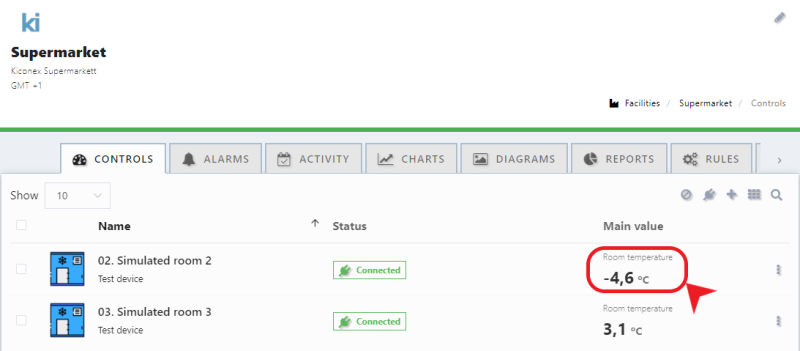
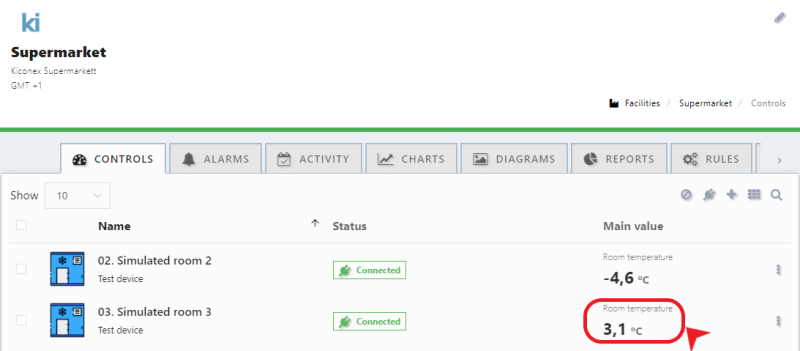
The process for overlapping several graphs is shown below:
