Translations:Graphics/6/en

De wiki.kiconex
Revisión del 07:03 10 abr 2024 de Bruiz (discusión | contribs.)
(difs.) ← Revisión anterior | Revisión actual (difs.) | Revisión siguiente → (difs.)

Saving a graph permanently =

There is the possibility to permanently save the graph, in order to have it accessible from the list of graphs of the user (left side menu) or from the list of graphs of the facility(menu "GRAPHICS" inside the facility). The following images show a graph with the data of several variables and the saving process:
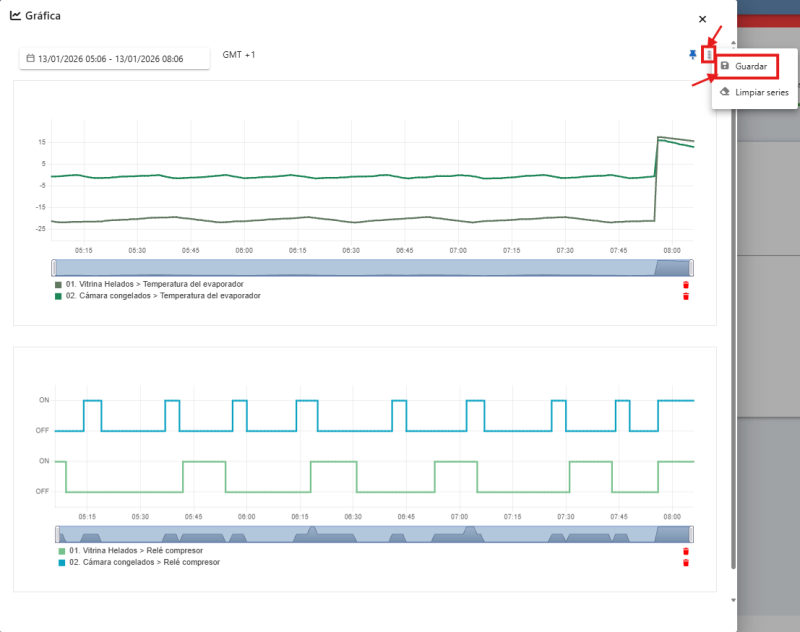
Save graph button
1 - Click on Save option in the graph that opens from the control view.
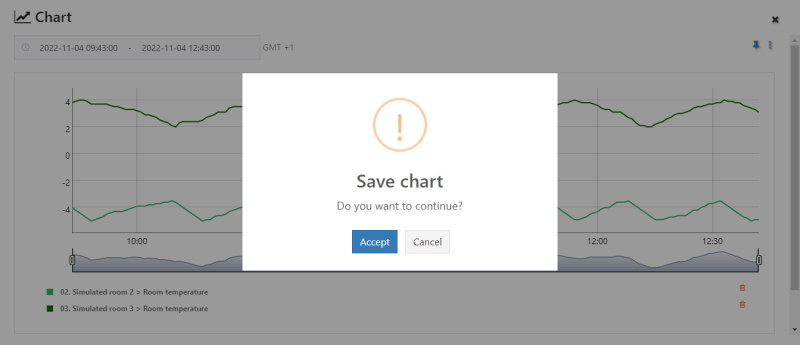
Save graph confirmation
2 - Confirm creation of the graph.
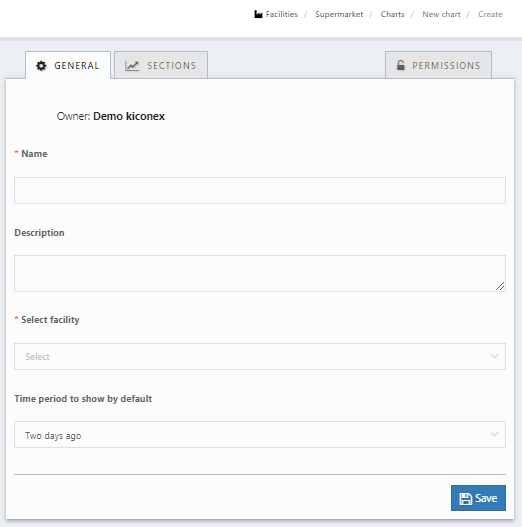
General data new graph
3 - Specify general data of the graph: name, description, facility to which it belongs and period of time that will be displayed by default when accessing it.
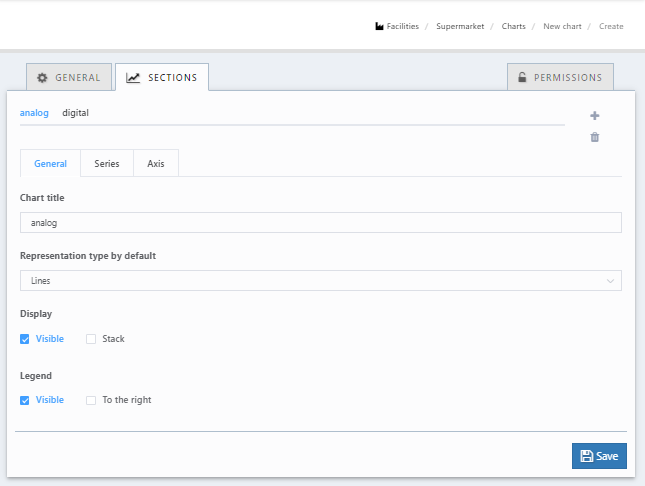
Section data new graph
4 - The variables that appeared in the graph are shown in "SECTIONS" tab. Here, it is able to adjust how you want to see the data curves. The saving process is completed by clicking on the blue "SAVE" button.