Translations:Reports/19/en
De wiki.kiconex
Interpretation of a statistical report
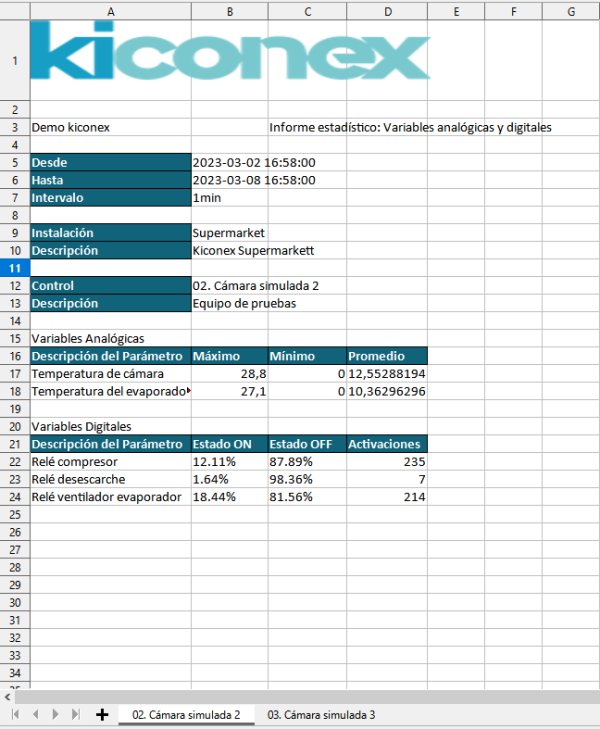
The result of downloading a statistical report, is an excel with the appearance of the following image:

The information displayed is as follows:
- Logo of the organization in the header.
- User who has downloaded the report.
- Time data:
- Start date of the analyzed data
- End date of the data
- Interval or time between each data involved in the analysis.
- Name and description of the facility to which the variables belong.
- Name and description of the control containing the variables.
- Analysis of analog variables, with the data: maximum, minimum and average.
- Analysis of digital variables: indicates % on and % off, as well as a count of the number of activations the variable has undergone.
