Facilities/en
Facilities
This is the section where the controls to be monitored for each of the deployed kiBoxes are grouped. One kiBox corresponds to an installation, and each installation is composed of one or more controls, which are the ones with the sensors and actuators.
It can be accessed in two ways: from the side menu or from the main menu where it indicates the number of facilities to which you have access:
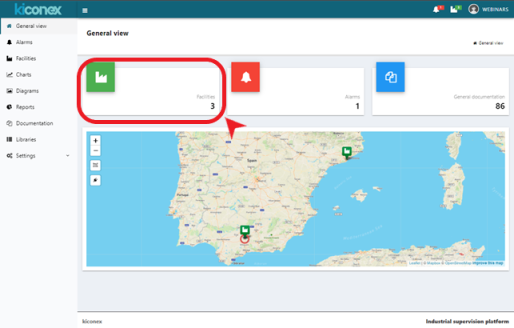
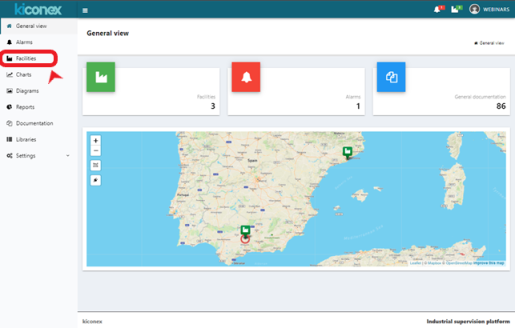
Regardless of where you access, all the facilities you have access to will be listed. There are three tabs associated with the facilities:
- Facilities
- Location
- Groups
Facilities tab
This tab lists all facilities to which the user has "view" permissions.
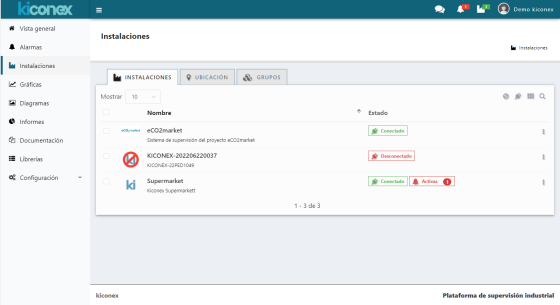
A cross-out red circle over the facility means that it is disabled.
The status column shows the current status of each facility:
- Connected: The "connected" symbol appears in green and means that such installation is connected to the server and we can interact with it.
- Disconnected: The "disconnected" symbol appears in red and means that such facility is not connected to the server. For some reason, the kiBox belonging to that facility does not have internet access and therefore cannot connect to the server. In that case, we can only get historical values stored by the server but not real time data.
- Active #: This symbol in red indicates, by means of the number attached to the text, the number of alarms currently active in that facility. The alarms can be connectivity alarms or alarms specific to the monitored device.
In the upper right corner of the tab there are a series of buttons to interact with the list of facilities and to filter according to their status:
- Enabled/Disabled: With the crossed out circle button you can toggle between filtering enabled installations (green color), disabled installations (red color) and list all installations (gray color).
- Connected/Disconnected: With the plug-shaped button you can apply the filter to show only connected installations (green color), only by disconnected installations (red color) and by all installations (gray color). This filter can be combined with the previous filter for enabled/disabled installations, e.g. to list only enabled and connected installations at the same time.
- Grid view: by clicking on the grid button, the installations are displayed in grid format instead of list format. Clicking this button again toggles between the two modes.
- Search button: with the magnifying glass button it is possible to filter by installations containing this name in their "name", "description" and "UUID" fields.
Clicking on any of the facilities takes you directly to the facility menu, which is described below, in the facility section.
Location tab
This tab presents the location of each facility on a map. It is possible to navigate on the map using the mouse or by swiping a finger on cell phones. It is also possible to zoom in/out using the mouse scroll or by using the "+" and "-" buttons at the top left of the map.
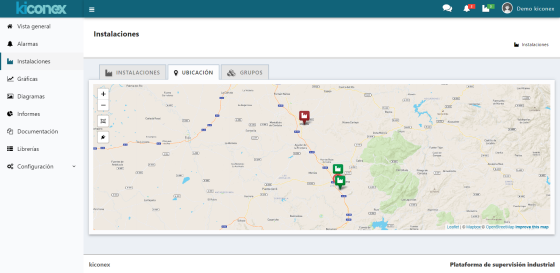
This map shows the facilities that are connected in green and those that are not connected in red. If there is an active alarm in any facility, this will be indicated on this map by a red circle flashing just below the facility with alarm.
On this map it is also possible to filter the facilities according to the clicks on the "plug" button on the left of the map:
- Gray plug: all facilities are displayed. No filtering is applied on the installations.
- Red plug: only the facilities that are switched-off are displayed.
- Green plug: only the facilities that are switched-on are displayed.
By clicking on the plug repeatedly, the different filters are alternated.
Groups tab
In the GROUPS tab, groups of facilities can be created for better management, classification and quick access. Each group has an alarm indicator which will be activated if any of the facilities included in this group has, at least, one active alarm.
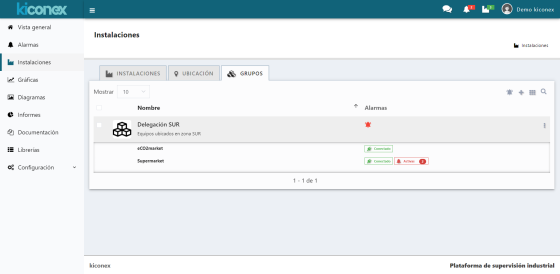
Click on the "+" button at the top right to create a group of facilities. A window will open where the group to be created can be configured.
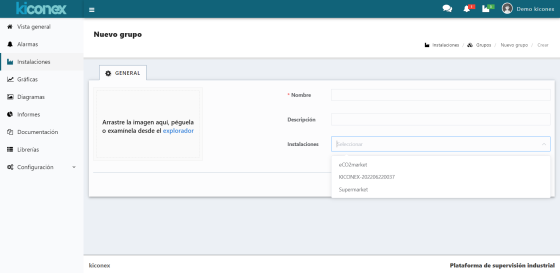
To create a group it is necessary to assign a name to it. You can also optionally include a description of the group, which will be visible just below the name.
The next step is to select the facilities that will be part of this group.
Finally, a picture can be assigned to identify the group quickly and clearly. Once the configuration process has been completed, click on the "Save" button.
Facility
Once you have clicked to access a specific facility, the screen with the main tools of it appears.
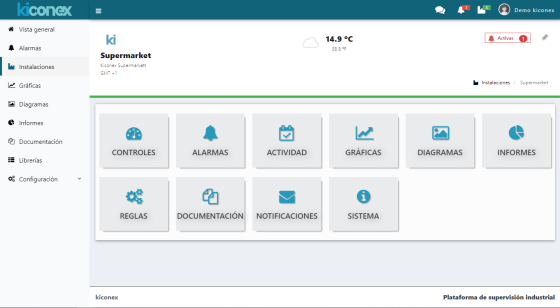
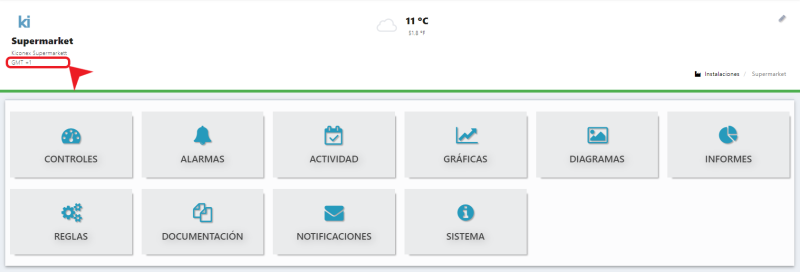
At top left is shown the name of the facility, its description and the time zone where the facility is located (e.g. the facility in the image below is located in GMT+1).
The number of active alarms in the facility as well as the number of silenced alarms can be displayed at top left.
A pencil icon will also appear at top right corner to edit and configure the facility. This icon will only appear to users who have permissions to view and edit on this facility.
Between the upper part and the lower part with the different sections there is a line that may appear green or red depending on whether the facility is connected or not.
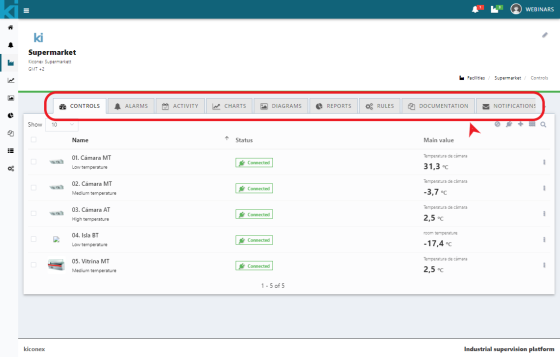
Finally, the lower part includes icons to access the following sections of each facility:
- Controls: Direct access to the list of controls belonging to that facility.
- Alarms: In this section you can check all the active alarms in the facility as well as their history.
- Activity: Section to check all the actions performed on that facility by the users with access to the facility.
- Graphs: Direct access to the quick graphs created for the facility.
- Diagrams: Access to the diagrams (SCADA) created for the facility.
- Reports: Section for exporting and creating reports on operation of the different controls of the facility.
- Rules: Section to be able to create and configure logical rules to take actions in case certain events and/or conditions are met.
- Documentation: Quick access to a repository to store and consult all types of documents associated with the facility.
- Notifications: Section to configure alarm notifications via e-mails or SMS to the configured users.
- System: Information about the operation and current status of the facility. Mainly information about the kiBox device behind the facility.
This menu appears at the top once it has accessed a facility.
.
If you cannot see one of these tabs, it is because your subscription does not include access to this tool.
Weather and current forecast
For those facilities that have previously been located on the map, the system will identify their location and will be able to link the facility with the weather forecast for that area. At the top center of the screen, an icon will appear with the current temperature for that area as well as the current weather condition. If you click on the weather icon a pop-up window will appear with the forecast for the week.
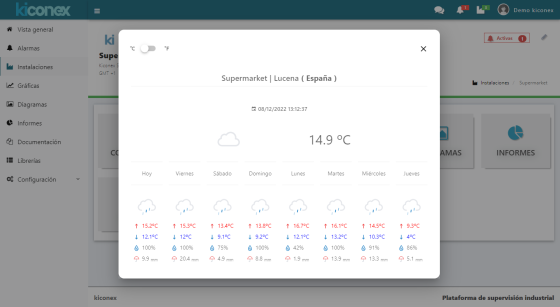
In this screen you can select the units for displaying the temperature, being able to switch between degrees centigrade and fahrenheits.
Editing and configuring the facility
Editing the installation can be accessed from two places:
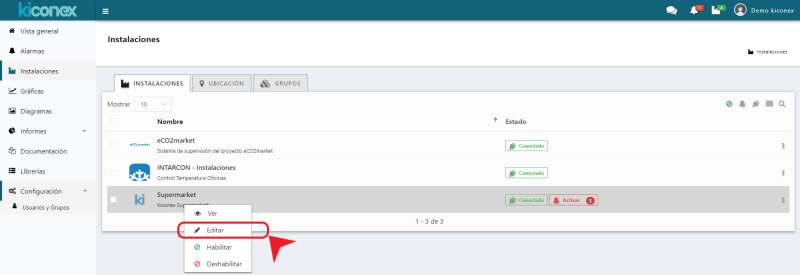
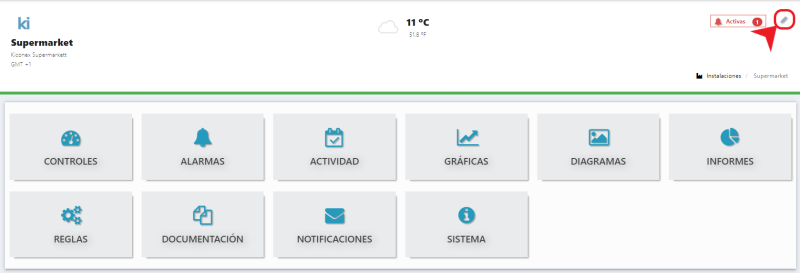
The facility configuration window has the following tabs:
GENERAL tab
From here you configure the name and description of the facility. You can also enable or disable and set an image to make it more visual in the list of facilities.
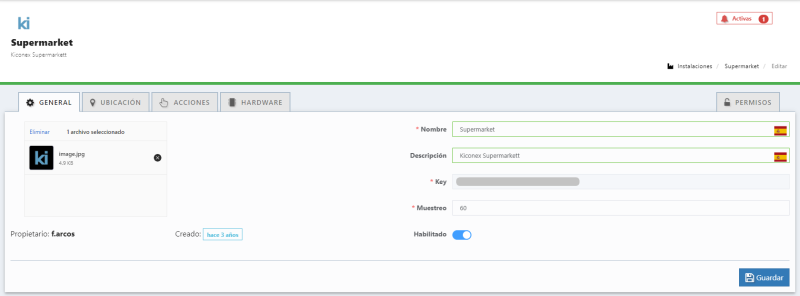
A disabled facility does not receive communications from the platform, so it does not show updated information of the controls connected to it.
LOCATION tab
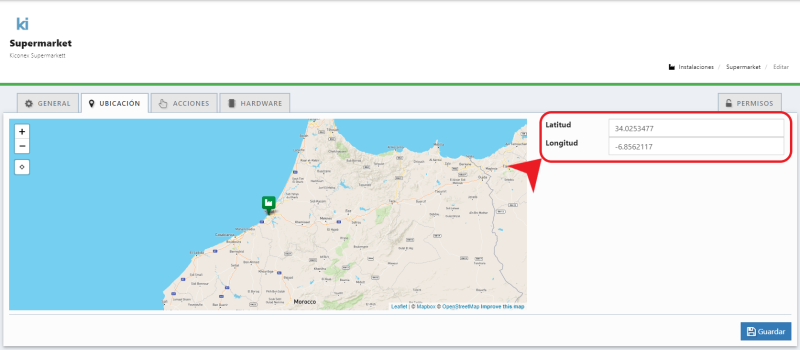
The location allows you to manually geolocate the facility using latitude and longitude data. This setting is of great importance: the platform uses this information to locate the facility in a time zone. This time zone is used for displaying historical data on a graph or for alarm notifications, so if not configured, all information is displayed with Greenwich Mean Time (GMT+0).
As mentiones, this is a manually set location, so kiBox does not synchronize and update it automatically. The format in which the latitude and longitude date is entered must be with decimal point, as extracted from Google Maps. An example is shown below:
ACTIONS tab
From this window, you can reload the facility configuration in the kiBox. It updates the configuration parameters of the facility, sending them back to the kiBox.

HARDWARE tab
This tab is one of the most important in the configuration of the facility. Here it is specified which RS485 ports of the kiBox are used and under which Modbus configuration: speed, stop bits, parity, etc.
Possible configurations for each port are:
- Function:
- Disabled: port with no use.
- Modbus RTU - Master: port with a standard use for monitoring controls under Modbus RTU protocol.
- Modbus RTU - Bridge: port used to serve information to another monitoring system external to kiConex. A port configured in this way makes the kiBox act as a Modbus RTU slave, serving the information of all the controls connected to those ports configured in MASTER mode.
- Speed (bps): Modbus communication speed in bps. Supported: 300, 1200, 2400, 4800, 9600, 19200, 38400, 57600 and 115200.
- Data bits: data bits of the transmission. It must match the configuration of the connected controls. It can have the value 7 or 8.
- Parity: the parity bits allow the frame receiver control to determine if the received message is corrupted. This data must also be set to match the value configured by the control. The possibilities are: none, odd and even.
- Stop bits: the value can be 1 or 2. This value, like the previous parameters, must be set according to the configuration of the controls to be connected to the bus.
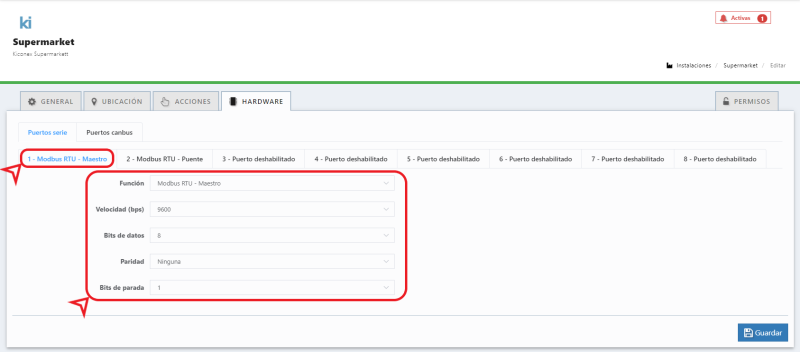
Information: to know how the port configuration parameters should be set, from kiconex we recommend reviewing the operating manuals of the controls to be connected to the kiBox, in the section where Modbus communication is described.
PERMISSIONS tab
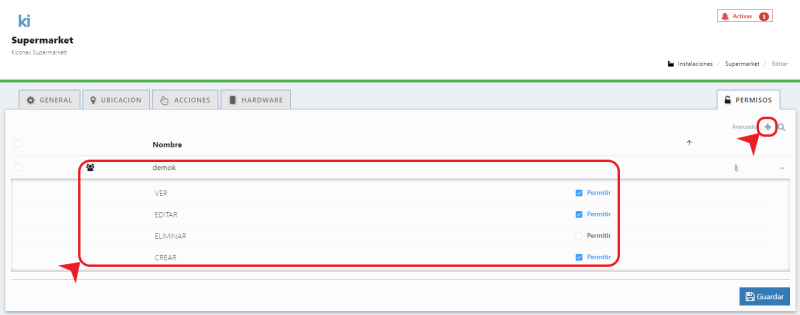
The permissions section allows you to give access to another existing user on the mykiconex platform. The possibilities are:
- View: to view the facility element, but not its content: connected controls, graphs, diagrams, etc.... All these elements have their own permissions.
- Edit: to access the facility configuration menu to modify name, description and port configuration.
- Create: allows you to create new elements within the facility: controls, graphs, charts, diagrams, rules, etc.
- Delete: it gives the user the possibility to delete the facility completely.
The user is added from the button with + symbol, located at the top right corner, as shown below:
Facility sections
Controls list
The control list is the section where the different controls (devices) that are connected to a facility (kiBox) are summarized. This section is detailed in depth in the controls section.
Alarms
In the alarms section, facility active alarms (as well as the alarm history) can be checked. The detailed explanation of each of the alarms and the information that can be obtained from them can be found in the alarms section.
Activity
This section register any action carried out on an element of the facility, such as: setpoint change, command sending, control configuration change...etc.
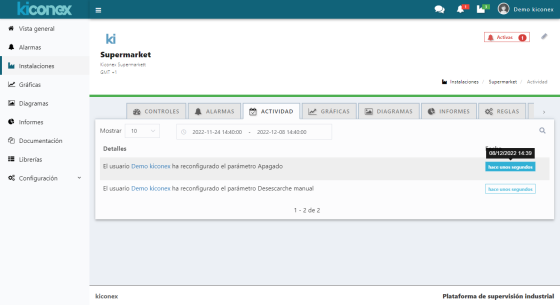
In this way, it is possible to keep track of what action has been performed on the elements of the facility and who has carried it out. This is very important since access to a facility can be enabled for a large number of users. It all depends on the configuration and permission levels assigned. Although permissions can be assigned by user group, it is always recommended to use a named user for one person and never share users among several people. This way it is easier to identify the user who has carried out a particular action.
Si se pasa el ratón por encima del texto que indica el registro del evento, nos indicará la fecha y hora exacta en la que se produjo dicho evento.
Gráficas
Las gráficas es una de las herramientas más útiles para poder estudiar el comportamiento de los equipos y evaluar su correcto funcionamiento. Las gráficas se explican en detalle en la sección gráficas de datos
Diagramas
Diagramas es un módulo para poder crear sinópticos de las instalaciones. Es decir, se puede crear una imagen con símbolos y variables dinámicas para, de un sólo vistazo, poder conocer y controlar el estado de la instalación. En otras palabras se puede crear SCADAS fácilmente dentro de este módulo. El módulo se explica en detalle en la sección diagramas
Informes
La plataforma myKiconex permite generar una serie de informes variados para poder facilitar el estudio del comportamiento de controles e instalaciones. Estos informes, y como generarlos, se explica en detalle en la sección informes
Reglas
El módulo de reglas permite realizar programaciones del tipo IF..THEN...Es decir, programaciones donde cuando se cumplen unas condiciones (IF) se realizan unas acciones (THEN). Todo ello puedo estar gestionado bajo un programador horario donde se indica las fechas y horas cuando se deben de evaluar dichas programaciones. Todo este módulo esta detalladamente explicado en la sección reglas
Documentación
La plataforma myKiconex permite alojar documentos en la nube. De esta forma, se puede disponer de documentación relacionada con los controles y/o instalaciones desde cualquier lugar. En la sección documentos se explica como utilizar este módulo.
Notificaciones
El módulo de notificaciones permite informar a los usuarios sobre eventos de alarmas o desconexión de elementos. Las notificaciones podrán ser vía email o SMS, según el plan contratado. En la sección notificaciones se detalla como configurar correctamente dichas notificaciones.
Sistema
En esta sección obtenemos información sobre el kiBox utilizado como pasarela en esta instalación.
Permisos
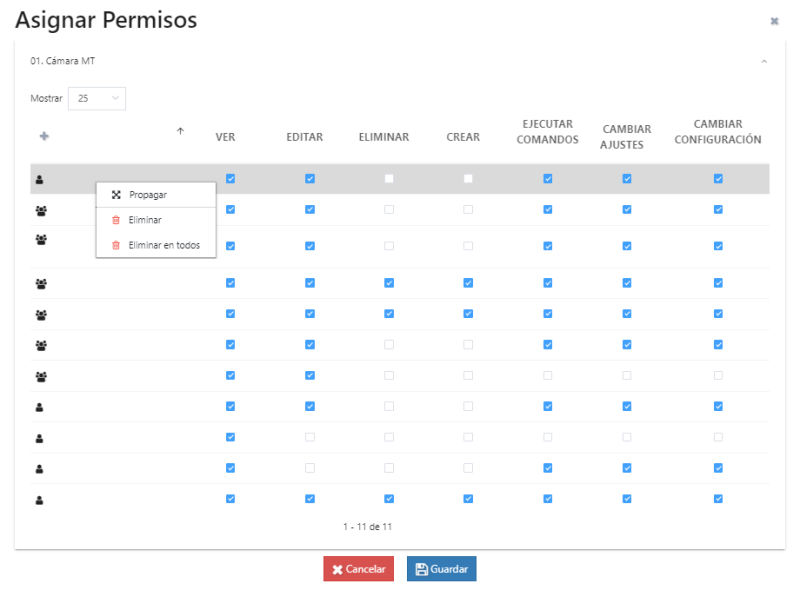
En cada uno de los objetos y/o elementos de la instalación existe la configuración de permisos, para que un usuario y/o grupo tenga permisos sobre una gráfica, diagrama, regla o informe debe tenerlos configurados.

Al crear algún elemento los permisos se heredan de la instalación, en el caso de los controles hay que seleccionar (en caso de ser necesario) ejecutar comandos, cambiar ajustes o cambiar configuración en cambio en los demás elementos tienen sólo las opciones de Ver, Editar, Eliminar y Crear.
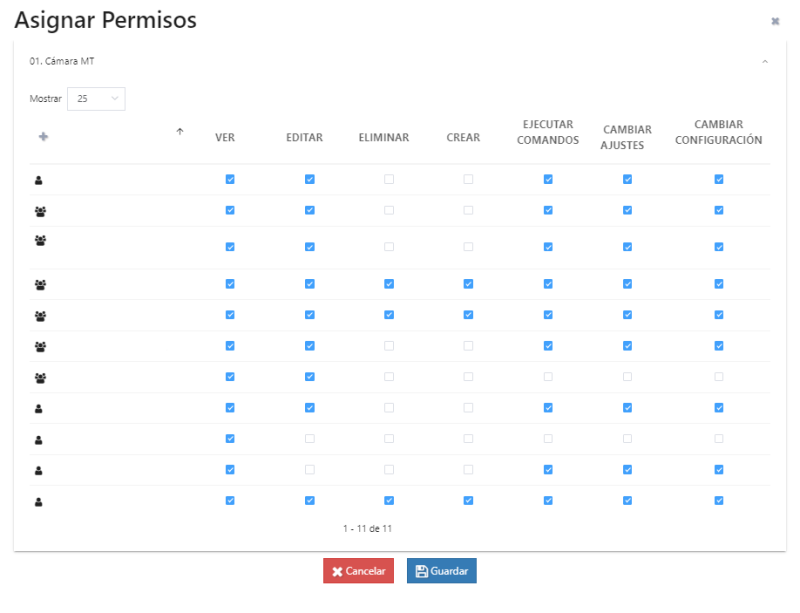
Con ellos se mantiene la gestión de la instalación correctamente indicando los permisos correspondientes según necesidad de la instalación o según niveles de usuarios.
- Ver: Permite la visualización sobre el objeto.
- Editar: Permite la edición del objeto.
- Eliminar: Permite eliminar el objeto, siempre que tenga el permiso de eliminar sobre los permisos de la instalación.
- Crear: Permite crear el objeto o en él, siempre que tenga el permiso de crear sobre los permisos de la instalación.
- Ejecutar comandos: Permite ejecutar comandos sobre el control.
- Cambiar ajustes: Permite cambiar ajustes sobre el control.
- Cambiar configuración: Permite cambiar la configuración sobre el control.
En los controles se pueden separar los permisos según si se requiere permisos en todos los controles o no, también existe la opción de propagar estos permisos seleccionando los permisos en un control y extendiéndolos a los demás para que queden así unificados según necesidad.
