Facilities/en
Facilities
This is the section where the controls to be monitored for each of the deployed kiBoxes are grouped. One kiBox corresponds to an installation, and each installation is composed of one or more controls, which are the ones with the sensors and actuators.
It can be accessed in two ways: from the side menu or from the main menu where it indicates the number of facilities to which you have access:
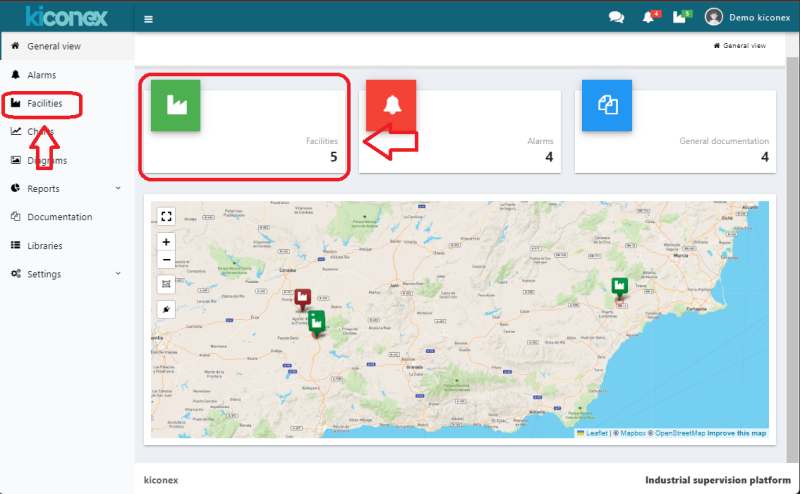
Regardless of where you access, all the facilities you have access to will be listed. There are three tabs associated with the facilities:
- Facilities
- Location
- Groups
Facilities tab
This tab lists all facilities to which the user has "view" permissions.
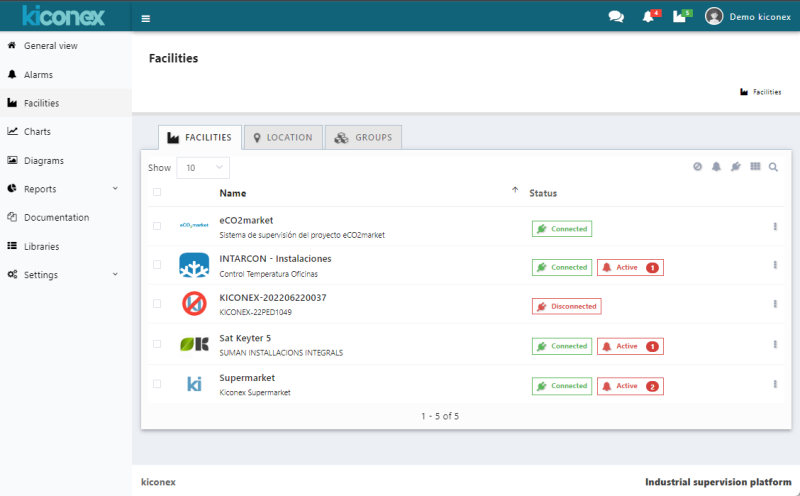
A cross-out red circle over the facility means that it is disabled.
The status column shows the current status of each facility:
- Connected: The "connected" symbol appears in green and means that such installation is connected to the server and we can interact with it.
- Disconnected: The "disconnected" symbol appears in red and means that such facility is not connected to the server. For some reason, the kiBox belonging to that facility does not have internet access and therefore cannot connect to the server. In that case, we can only get historical values stored by the server but not real time data.
- Active #: This symbol in red indicates, by means of the number attached to the text, the number of alarms currently active in that facility. The alarms can be connectivity alarms or alarms specific to the monitored device.
In the upper right corner of the tab there are a series of buttons to interact with the list of facilities and to filter according to their status:
- Enabled/Disabled: With the crossed out circle button you can toggle between filtering enabled installations (green color), disabled installations (red color) and list all installations (gray color).
- Connected/Disconnected: With the plug-shaped button you can apply the filter to show only connected installations (green color), only by disconnected installations (red color) and by all installations (gray color). This filter can be combined with the previous filter for enabled/disabled installations, e.g. to list only enabled and connected installations at the same time.
- Grid view: by clicking on the grid button, the installations are displayed in grid format instead of list format. Clicking this button again toggles between the two modes.
- Search button: with the magnifying glass button it is possible to filter by installations containing this name in their "name", "description" and "UUID" fields.
Clicking on any of the facilities takes you directly to the facility menu, which is described below, in the facility section.
Location tab
This tab presents the location of each facility on a map. It is possible to navigate on the map using the mouse or by swiping a finger on cell phones. It is also possible to zoom in/out using the mouse scroll or by using the "+" and "-" buttons at the top left of the map.
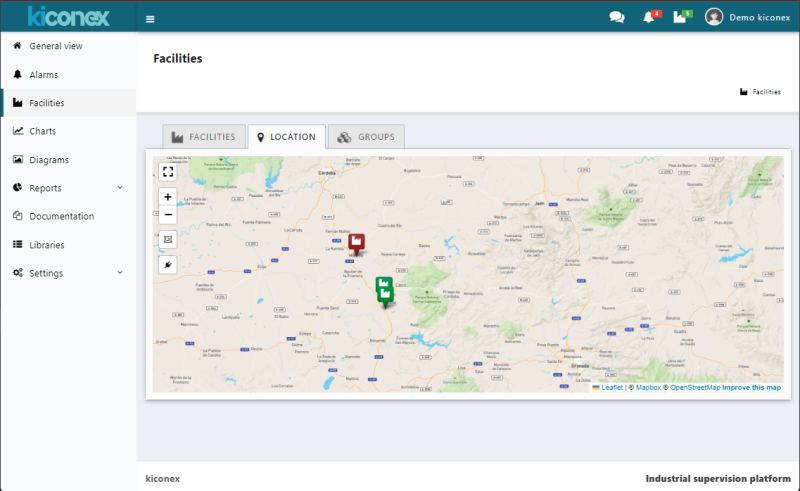
This map shows the facilities that are connected in green and those that are not connected in red. If there is an active alarm in any facility, this will be indicated on this map by a red circle flashing just below the facility with alarm.
On this map it is also possible to filter the facilities according to the clicks on the "plug" button on the left of the map:
- Gray plug: all facilities are displayed. No filtering is applied on the installations.
- Red plug: only the facilities that are switched-off are displayed.
- Green plug: only the facilities that are switched-on are displayed.
By clicking on the plug repeatedly, the different filters are alternated.
Groups tab
In the GROUPS tab, groups of facilities can be created for better management, classification and quick access. Each group has an alarm indicator which will be activated if any of the facilities included in this group has, at least, one active alarm.
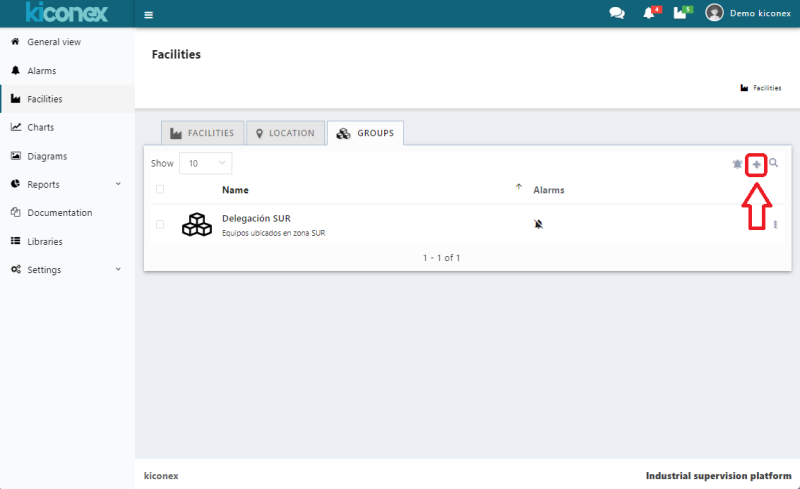
Click on the "+" button at the top right to create a group of facilities. A window will open where the group to be created can be configured.
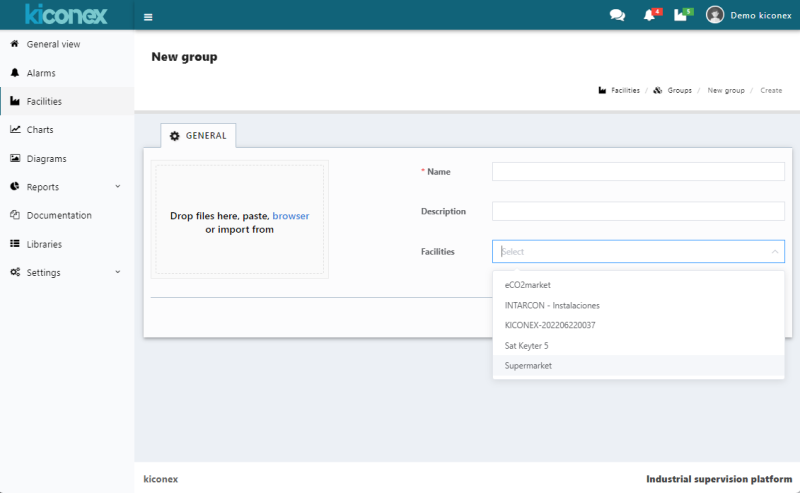
To create a group it is necessary to assign a name to it. You can also optionally include a description of the group, which will be visible just below the name.
The next step is to select the facilities that will be part of this group.
Finally, a picture can be assigned to identify the group quickly and clearly. Once the configuration process has been completed, click on the "Save" button.
Facility
Once you have clicked to access a specific facility, the screen with the main tools of it appears.
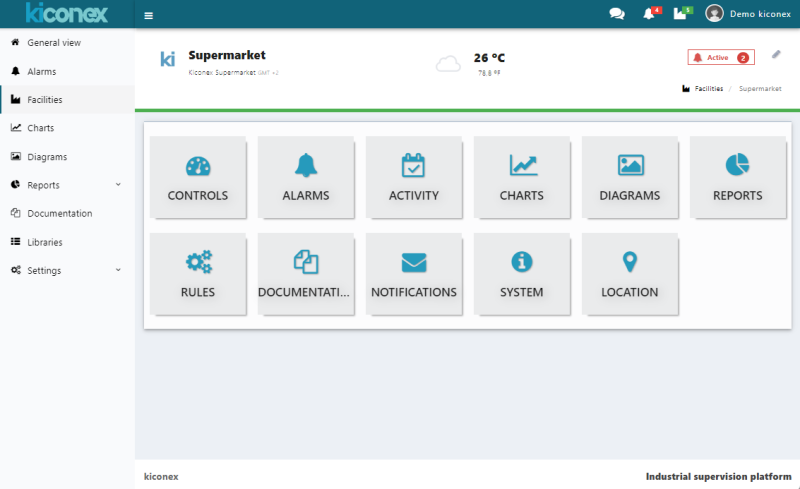
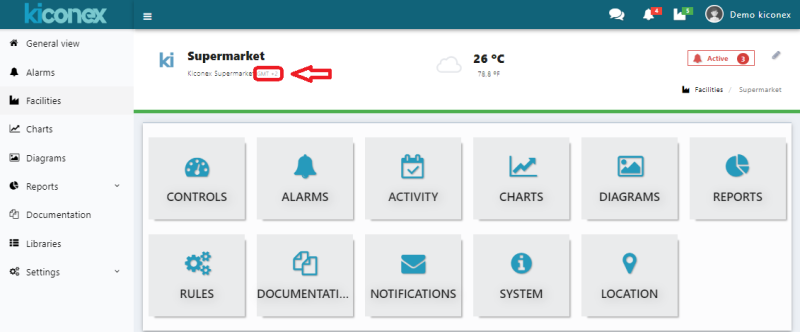
At top left is shown the name of the facility, its description and the time zone where the facility is located (e.g. the facility in the image below is located in GMT+1).
The number of active alarms in the facility as well as the number of silenced alarms can be displayed at top left.
A pencil icon will also appear at top right corner to edit and configure the facility. This icon will only appear to users who have permissions to view and edit on this facility.
Between the upper part and the lower part with the different sections there is a line that may appear green or red depending on whether the facility is connected or not.
Finally, the lower part includes icons to access the following sections of each facility:
- Controls: Direct access to the list of controls belonging to that facility.
- Alarms: In this section you can check all the active alarms in the facility as well as their history.
- Activity: Section to check all the actions performed on that facility by the users with access to the facility.
- Graphs: Direct access to the quick graphs created for the facility.
- Diagrams: Access to the diagrams (SCADA) created for the facility.
- Reports: Section for exporting and creating reports on operation of the different controls of the facility.
- Rules: Section to be able to create and configure logical rules to take actions in case certain events and/or conditions are met.
- Documentation: Quick access to a repository to store and consult all types of documents associated with the facility.
- Notifications: Section to configure alarm notifications via e-mails or SMS to the configured users.
- System: Information about the operation and current status of the facility. Mainly information about the kiBox device behind the facility.
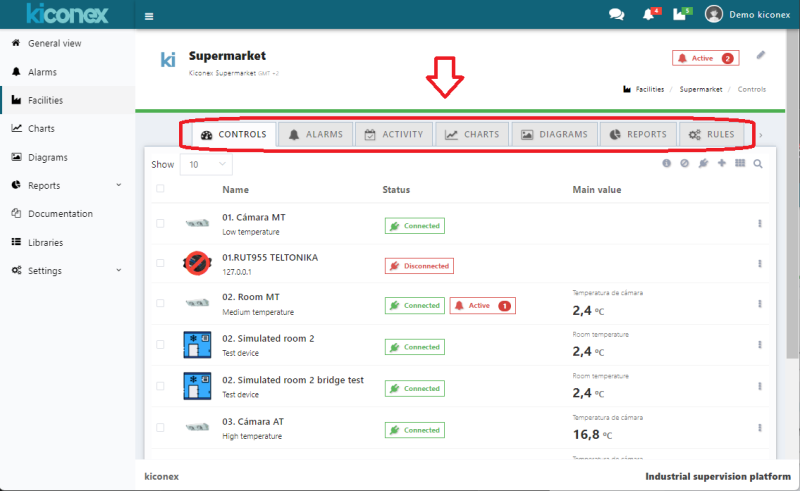
This menu appears at the top once it has accessed a facility.
.
If you cannot see one of these tabs, it is because your subscription does not include access to this tool.
Weather and current forecast
For those facilities that have previously been located on the map, the system will identify their location and will be able to link the facility with the weather forecast for that area. At the top center of the screen, an icon will appear with the current temperature for that area as well as the current weather condition. If you click on the weather icon a pop-up window will appear with the forecast for the week.
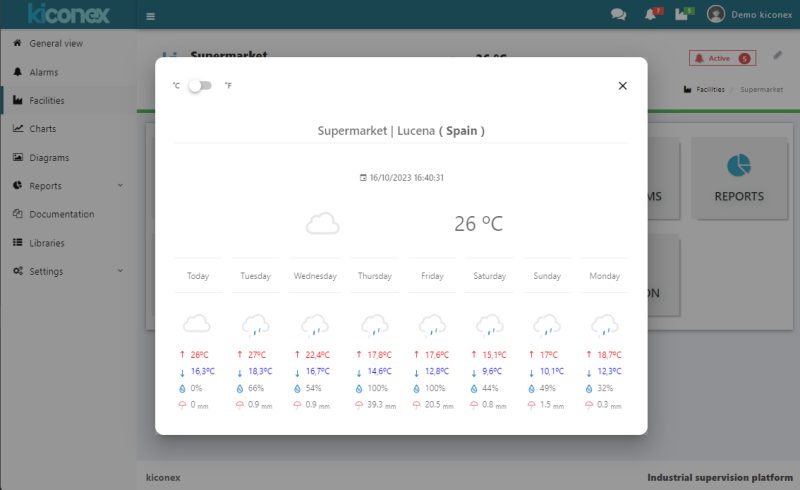
In this screen you can select the units for displaying the temperature, being able to switch between degrees centigrade and fahrenheits.
Editing and configuring the facility
Editing the facility can be accessed from two places:
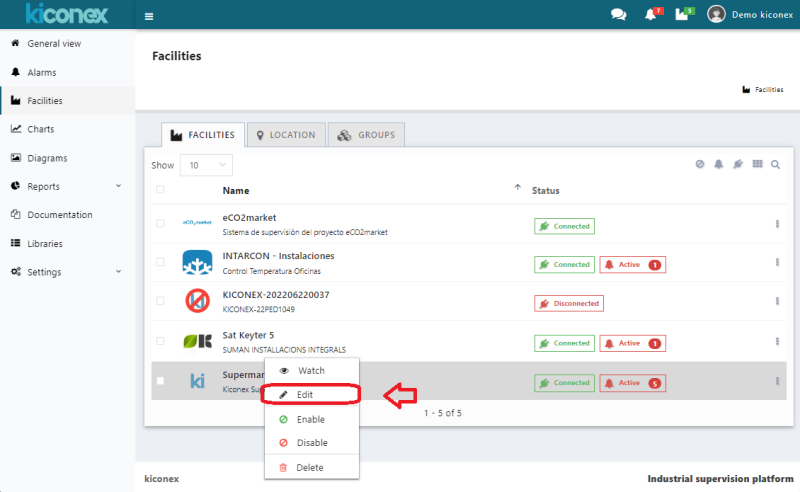
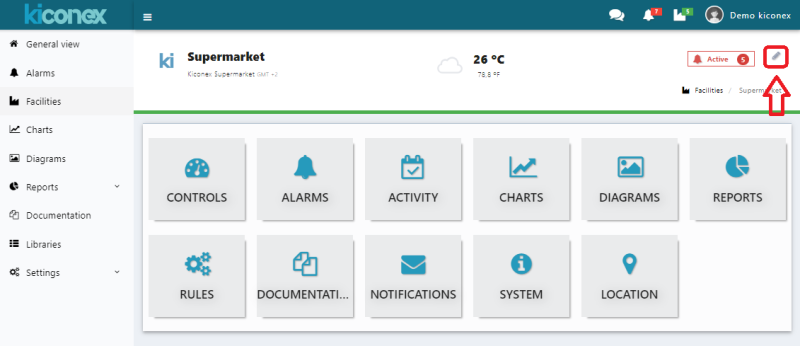
The facility configuration window has the following tabs:
GENERAL tab
From here you configure the name and description of the facility. You can also enable or disable and set an image to make it more visual in the list of facilities.
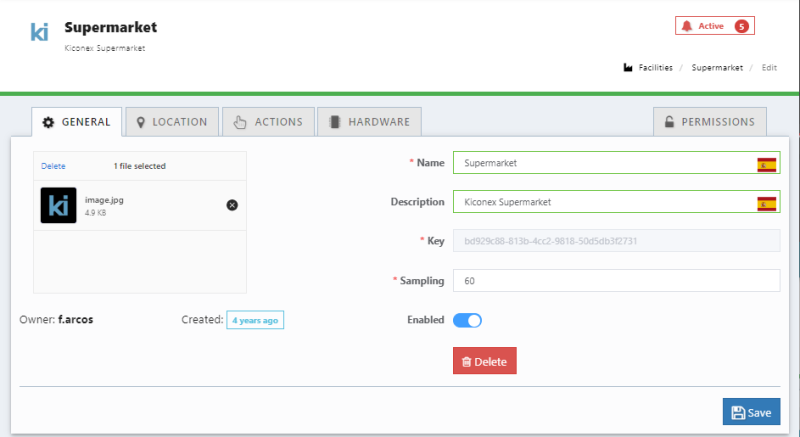
A disabled facility does not receive communications from the platform, so it does not show updated information of the controls connected to it.
LOCATION tab
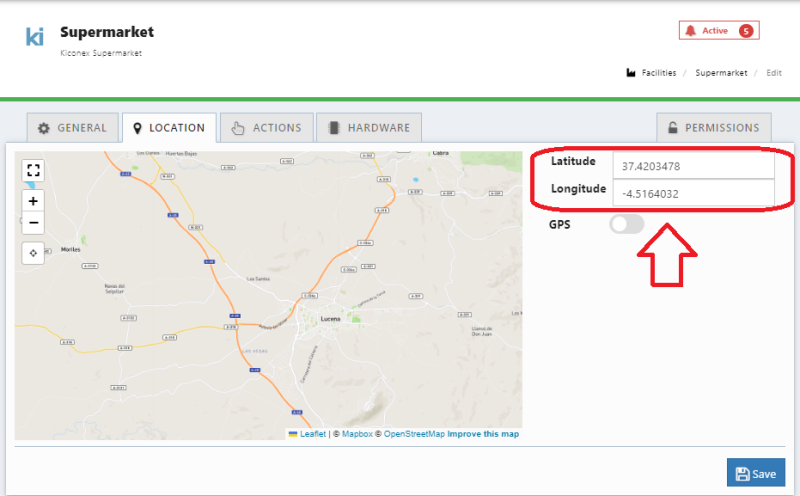
The location allows you to manually geolocate the facility using latitude and longitude data. This setting is of great importance: the platform uses this information to locate the facility in a time zone. This time zone is used for displaying historical data on a graph or for alarm notifications, so if not configured, all information is displayed with Greenwich Mean Time (GMT+0).
As mentioned, this is a manually set location, so kiBox does not synchronize and update it automatically. The format in which the latitude and longitude date is entered must be with decimal point, as extracted from Google Maps. An example is shown below:
ACTIONS tab
From this window, it is possible to perform one of these actions on the kibox:
- Send: resend to the kibox the current configuration of the facility: port configuration, protocols, list of controls and libraries used, etc.
- Restart: restart the software used by the kibox to send data to myKiconex.
- Restore': stops the kibox software, deletes the facility configuration information and restarts the software.

HARDWARE tab
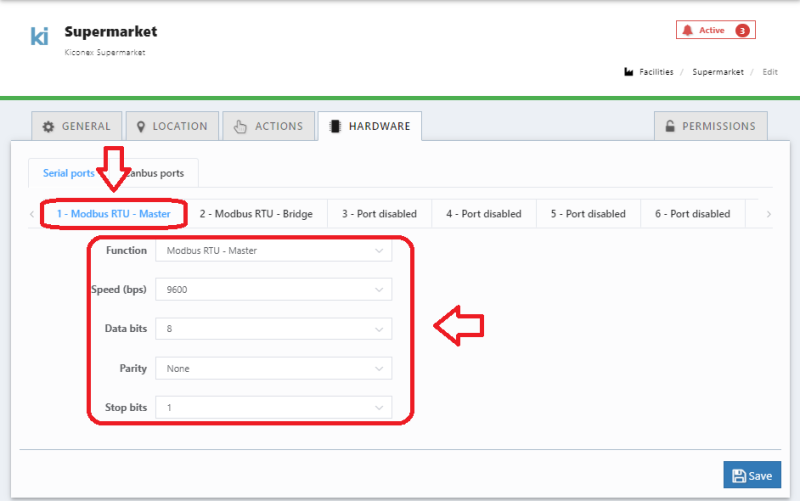
This tab is one of the most important in the configuration of the facility. Here it is specified which RS485 ports of the kiBox are used and under which Modbus configuration: speed, stop bits, parity, etc.
Possible configurations for each port are:
- Function:
- Disabled: port with no use.
- Modbus RTU - Master: port with a standard use for monitoring controls under Modbus RTU protocol.
- Modbus RTU - Bridge: port used to serve information to another monitoring system external to kiConex. A port configured in this way makes the kiBox act as a Modbus RTU slave, serving the information of all the controls connected to those ports configured in MASTER mode.
- Speed (bps): Modbus communication speed in bps. Supported: 300, 1200, 2400, 4800, 9600, 19200, 38400, 57600 and 115200.
- Data bits: data bits of the transmission. It must match the configuration of the connected controls. It can have the value 7 or 8.
- Parity: the parity bits allow the frame receiver control to determine if the received message is corrupted. This data must also be set to match the value configured by the control. The possibilities are: none, odd and even.
- Stop bits: the value can be 1 or 2. This value, like the previous parameters, must be set according to the configuration of the controls to be connected to the bus.
Information: to know how the port configuration parameters should be set, from kiconex we recommend reviewing the operating manuals of the controls to be connected to the kiBox, in the section where Modbus communication is described.
PERMISSIONS tab
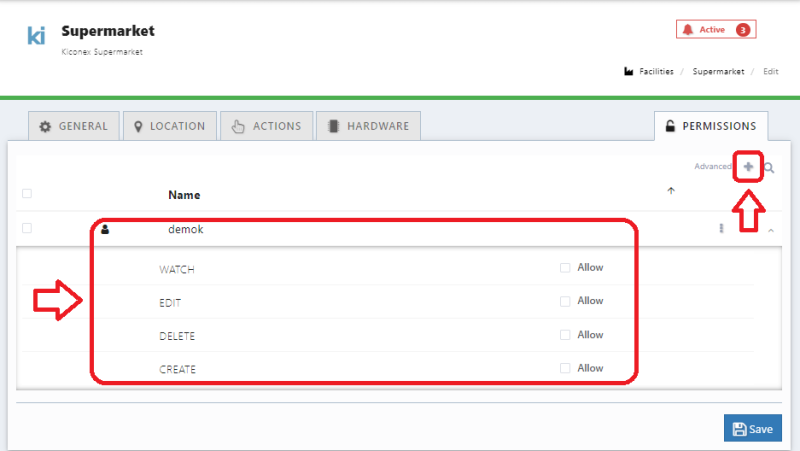
The permissions section allows you to give access to another existing user on the mykiconex platform. The possibilities are:
- View: to view the facility element, but not its content: connected controls, graphs, diagrams, etc.... All these elements have their own permissions.
- Edit: to access the facility configuration menu to modify name, description and port configuration.
- Create: allows you to create new elements within the facility: controls, graphs, charts, diagrams, rules, etc.
- Delete: it gives the user the possibility to delete the facility completely.
The user is added from the button with + symbol, located at the top right corner, as shown below:
Facility sections
Controls list
The control list is the section where the different controls (devices) that are connected to a facility (kiBox) are summarized. This section is detailed in depth in the controls section.
Alarms
In the alarms section, facility active alarms (as well as the alarm history) can be checked. The detailed explanation of each of the alarms and the information that can be obtained from them can be found in the alarms section.
Activity
This section register any action carried out on an element of the facility, such as: setpoint change, command sending, control configuration change...etc.
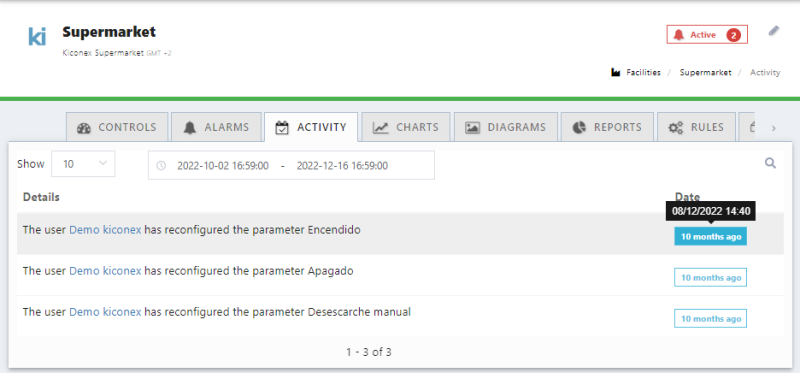
In this way, it is possible to keep track of what action has been performed on the elements of the facility and who has carried it out. This is very important since access to a facility can be enabled for a large number of users. It all depends on the configuration and permission levels assigned. Although permissions can be assigned by user group, it is always recommended to use a named user for one person and never share users among several people. This way it is easier to identify the user who has carried out a particular action.
Mouseovering over the text indicating the event record, it will show the exact date and time stamp at which the event ocurred.
Graphs
The graphs are one of the most useful tools to be able to study the behavior of the equipment and to evaluate its correct operation. The graphs are explained in detail in the section data graphs.
Diagrams
Diagrams is a module to create synoptic diagrams of the facilities. Images can be created with symbols and dynamic variables in order to know and control the status of the facility. This means that SCADAS can be easily created within this module. The module is explained in detail in the section diagrams.
Reports
myKiconex platform allows you to generate a series of various reports to facilitate the study of the behavior of controls and facilities. These reports, and how to generate them, are explained in detail in section reports.
Rules
The rules module allows to program [IF... THEN...] type rules, i.e. manage where when some conditions (IF) are fulfilled, some actions (THEN) are performed. All this can be managed under a time scheduler where the dates and times when these schedules must be evaluated are indicated. All this module is explained in detail in the section rules.
Documentation
myKiconex platform allows documents to be hosted in the cloud. In this way, documentation related to controls and/or facilities can be available from anywhere. The documents section explains how to use this module.
Notifications
The notifications module allows users to be informed about alarm events or disconnection of elements. Notifications can be sent via email or SMS, depending on the contracted plan. In section notifications you will find details on how to correctly configure these notifications.
System
In this section, information about the "kiBox" used as a gateway in the facility is gattered.
Permissions
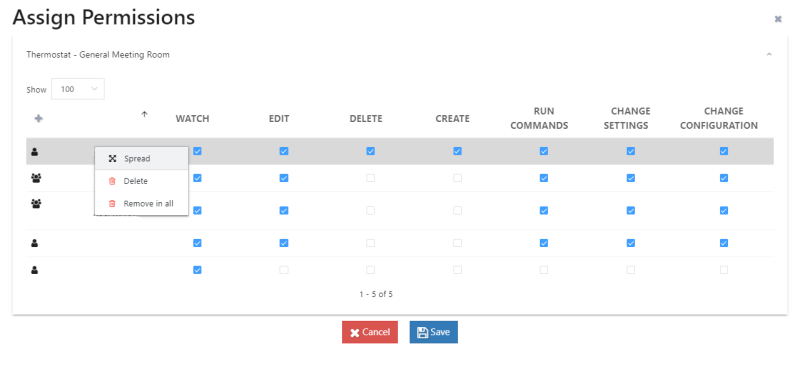
In each of the objects and/or elements of the facility there is a configuration of permissions. For an user and/or group to have permissions on a graph, diagram, rule or report, them must been configured.

When creating any element, the permissions are inherited from the facility. In the case of the controls you have to select (if necessary) execute commands, change settings or change configuration instead in the other elements have only the options View, Edit, Delete and Create.
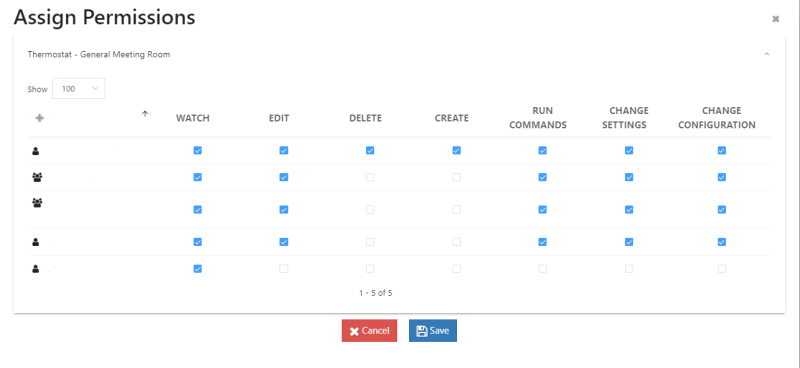
With the permissions, the management of the facility is maintained correctly indicating the corresponding permissions according to the need of the facility or according to user levels.
- View: Allows viewing the object.
- Edit: Allows the editing of the object.
- Delete: Allows deleting the object, provided that you have the delete permission on the facility permissions.
- Create: Allows to create the object or on it, as long as you have the permission to create on the facility permissions.
- Execute commands: Allows to execute commands on the control.
- Change settings: Allows to change settings on the control.
- Change configuration: Allows to change the configuration on the control.
In the controls it is possible to separate the permissions according to if permissions are required in all the controls or not, there is also the option to propagate these permissions selecting the permissions in a control and extending them to the others so that they are thus unified according to necessity.
